
Type of Correlation
Loading the math board and drawing, please wait…
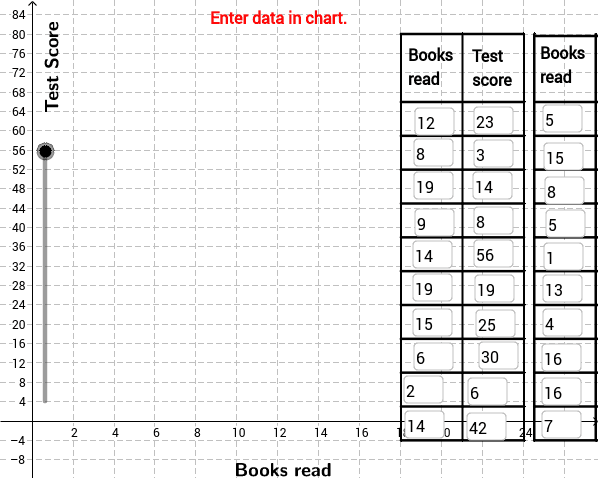
This example shows how to use the correlation coefficient to describe the strength of the linear relationship between data points. It covers core concepts such as the Pearson correlation coefficient (PMCC), regression line fitting, scatter plot analysis, and classification of correlation types. The construction uses GeoGebra commands FitLineY for the regression line, PMCC for the coefficient, and Textfield, If, Polygon, RotateText, Segment, Sequence for dynamic display of results and graphics. It is suitable for high school or first‑year university statistics and data analysis courses, as well as interactive learning for math enthusiasts.
GeoGebra Commands & Parameters
FitLineY(PointList1) → LineFitPMCC(PointList1) → CorCoeffTextfield(A2) → InA2Textfield(A3) → InA3Textfield(A4) → InA4Textfield(A5) → InA5Textfield(A6) → InA6Textfield(A7) → InA7Textfield(A8) → InA8Textfield(A9) → InA9Textfield(A10) → InA10Textfield(A11) → InA11Textfield(A12) → InA12Textfield(A13) → InA13Textfield(A14) → InA14Textfield(A15) → InA15Textfield(A16) → InA16Textfield(A17) → InA17Textfield(A18) → InA18Textfield(A19) → InA19Textfield(A20) → InA20Textfield(A21) → InA21Textfield(B2) → InB2Textfield(B3) → InB3Textfield(B4) → InB4Textfield(B5) → InB5Textfield(B6) → InB6Textfield(B7) → InB7Textfield(B8) → InB8Textfield(B9) → InB9Textfield(B10) → InB10Textfield(B11) → InB11Textfield(B12) → InB12Textfield(B13) → InB13Textfield(B14) → InB14Textfield(B15) → InB15Textfield(B16) → InB16Textfield(B17) → InB17Textfield(B18) → InB18Textfield(B19) → InB19Textfield(B20) → InB20Textfield(B21) → InB21If(LineVisible, "Hide Best Fit Line", "Show Best Fit Line") → LineButtonPolygon((21, y(Corner[1])), Corner[2], Corner[3], (21, y(Corner[4]))) → poly1, a, b, c, dRotateText("Test Score", 90*°) → SideLegendRotateText("Books read", 0) → BottomLegendIf(CorVisible, "Hide Correlation Coefficient", "Show Correlation Coefficient") → CorButtonSegment((17.99999951219512, 80.06896551724147), (23.95121951219512, 80.06896551724147)) → top1Segment((24.536580487804876, 79.65516896551733), (30.536580487804876, 79.65516896551733)) → top2Sequence(Segment[(18 + 3 * i, -4), (18 + 3 * i, 80)], i, 0, 2) → Linesv1Sequence(Segment[(24.5 + 3 * i, -4), (24.5 + 3 * i, 80)], i, 0, 2) → Linesv2Sequence(Segment[(24.5, 0 - 4 + 7 * i), (30.5, -4 + 7 * i)], i, 0, 10) → Linesh2Sequence(Segment[(18, 0 - 4 + 7 * i), (24, -4 + 7 * i)], i, 0, 10) → Linesh1