
Two-Proportions Test and Simulation
Loading the math board and drawing, please wait…
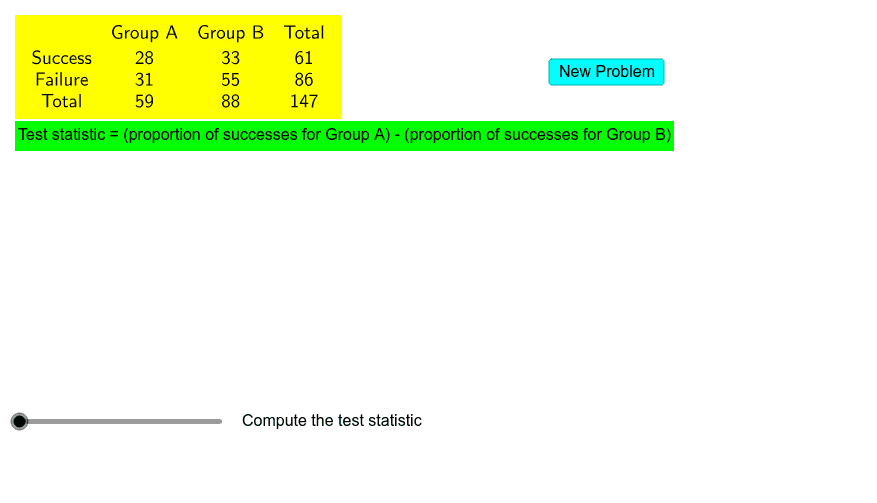
This example demonstrates hypothesis testing for two proportions using simulation. Key concepts include p-values, confidence intervals, and statistical significance. Construction involves generating random data tables with GeoGebra commands like Random and TableText. Suitable for high school students or introductory college courses in statistics.
GeoGebra Commands & Parameters
Random(10, 60) → bfRandom(10, 40) → afRandom(10, 50) → bsRandom(10, 40) → asTableText({header, success, failure, bottom}, "c") → text1If(n ≟ 1, "Compute the test statistic", If[n ≟ 2, "Write the competing hypotheses", If[n ≟ 3, "Describe how to conduct a simulation using index cards."]]) → text5
AI Drawing Prompt Reference
Create a statistical teaching diagram for a two-proportions hypothesis test. In the center, draw a random data table with four rows: header, success, failure, and bottom total, with columns representing two sample groups. Above or beside the table, place three text boxes showing step-by-step instructions: first, compute the test statistic; second, write the competing hypotheses; third, describe how to conduct a simulation using index cards. Arrange the elements clearly to highlight the relationship between the table data and the procedural hints, suitable for classroom demonstration.
The prompt above was compiled from the original drawing commands and is for reference only.