
Trigonometric Graph Transformation 2 (Radians)
Loading the math board and drawing, please wait…
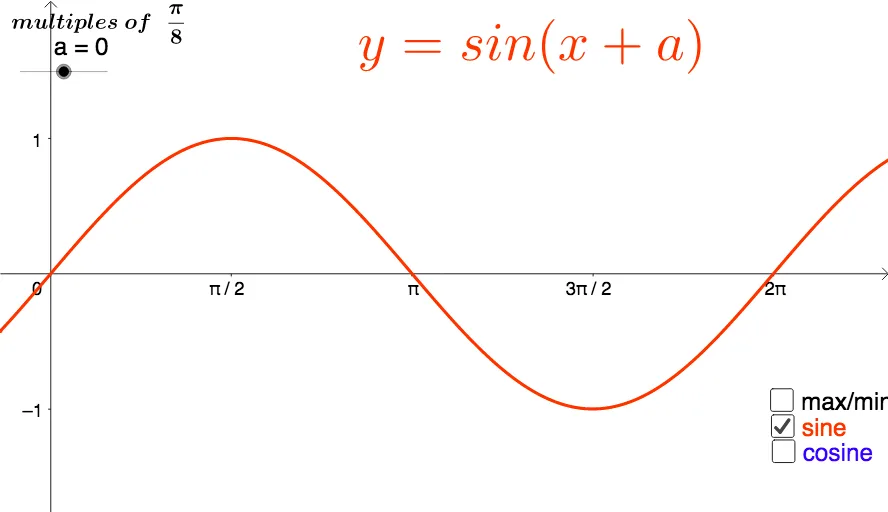
① This example demonstrates the dynamic transformation of sine and cosine function graphs under translations, stretches, and compressions in radian mode, allowing students to visually grasp how parameters affect the graph. ② Core mathematical concepts include periodicity, amplitude, phase shift, vertical shift, the distinction between radians and degrees, as well as extensions like function addition and geometric distribution. ③ Construction highlights: using GeoGebra commands such as If, Max, Min, and GCD to build conditional logic and parameter controls, sliders for interactive adjustment, and multiple text objects (text1 to text12) to label key points and values, with objects including function curves, auxiliary lines, and points A, B, D, etc., enabling an interactive transformation demonstration. ④ Suitable for high school or pre-university trigonometry instruction, useful for classroom demonstrations or student self-exploration to understand graph transformation rules and radian measure applications.
GeoGebra Commands & Parameters
If(a < 0, "-", If[a ≠ 0, "+", ""]) → text3If(a ≠ 0, (b * ""), "") → cMax(e, 0, 6.283185307179586) → AMin(e, 0, 7.853981633974483) → BMin(f, 0, 6.283185307179586) → DGCD(a, 8) → kGCD(n, 8) → oIf(n < 0, "-", "") → text10If(p ≠ 0 ∧ r ≠ 1, "\scriptsize\frac{" + p + "}{" + r + "}" + "\normalsizeπ", If[p ≟ 0, "0", "π"]) → text8GCD(t, 8) → uIf(v ≠ 0 ∧ w ≠ 1, "\scriptsize\frac{" + v + "}{" + w + "}" + "\normalsizeπ", If[v ≟ 0, "0", If[v ≟ 1, "π", "2π"]]) → text11GCD(z, a) → a_1If(b_1 ≠ 0 ∧ c_1 ≠ 1, "\scriptsize\frac{" + b_1 + "}{" + c_1 + "}" + "\normalsizeπ", If[b_1 ≟ 0, "0", "π"]) → text13Max(f, 0, 6.283185307179586) → CGCD(d_1, 8) → e_1If(a < 0, "\scriptsize\frac{" + l + "}{" + m + "}" + "\normalsizeπ", If[f_1 ≠ 0 ∧ g_1 ≠ 1, "\scriptsize\frac{" + f_1 + "}{" + g_1 + "}" + "\normalsizeπ", If[f_1 ≟ 0, "0", If[f_1 ≟ 1, "π", "0"]]]) → text16