
Computing Area Between Parabolas/Lines via Integration
Loading the math board and drawing, please wait…
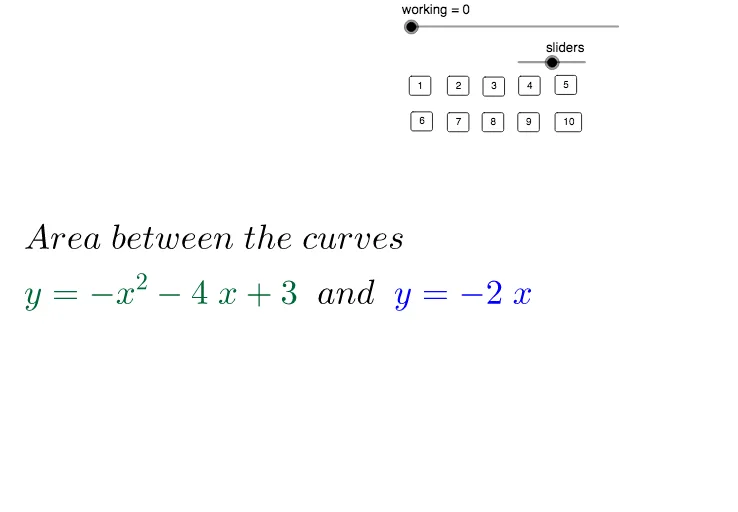
This example demonstrates how to compute the area of a planar region bounded by two parabolas or two lines using definite integration, visually linking the enclosed region to the integral value. The key ideas are integral calculus (definite integrals), determining intersection points to set the integration limits, identifying the top and bottom boundary functions, and handling algebraic simplification of expressions. Construction uses IntegralBetween and Integral to perform the area computation over the region; Intersect finds the boundary curves’ intersection points to define the interval. Coefficients and Element help organize parameters and extract terms, while FractionText turns results into readable fractional forms; GCD and HCF support simplifying expressions for cleaner outputs. List objects (list1, list2) and various text/GUI elements (including buttons) are employed to produce interactive outputs of the area formula or numerical value. Suitable for upper high school and early university students learning integral calculus and geometric area interpretation.
GeoGebra Commands & Parameters
IntegralBetween(F, G, b, a) → cIntegral(F(x) - G(x)) → hCoefficients(h) → list2Element(list2, 1) → dElement(list2, 2) → eElement(list2, 3) → iElement(list2, 4) → jCoefficients(F(x) - G(x)) → list1GCD(list1) → HCFIntersect(F, G) → B, AFractionText((1 / 3 * (n - k))) → text4FractionText(abs((1 / 2 * (o - l)))) → text7FractionText(abs(p - m)) → text8Intersect(t, a_2) → CFractionText(y(C)) → text11Intersect(t, b_1) → DFractionText(y(D)) → text10FractionText(c) → text14
AI Drawing Prompt Reference
Draw a planar region bounded by two parabolas or lines, showing the enclosed area. Plot the two boundary curves, mark their intersection points to define the integration interval. Shade the region between the curves and display the numerical area value. Also show the algebraic expression for the area calculation, including the integrand and integration limits. Present the area result as a simplified fraction. Include coordinate axes, curve labels, and text annotations for the area value, making the geometric meaning of definite integration clear.
The prompt above was compiled from the original drawing commands and is for reference only.