
Quadratic Formula Visualization
Loading the math board and drawing, please wait…
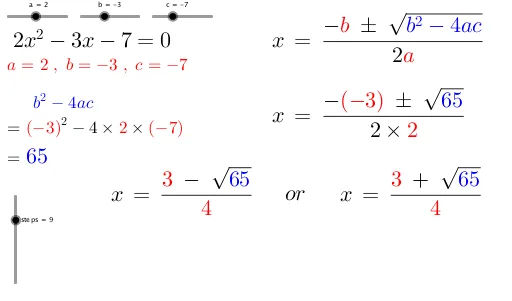
This example dynamically demonstrates the quadratic formula, visually linking roots to coefficients. Core concepts include quadratic equations, the quadratic formula, discriminant, and function graphing. GeoGebra commands like If, Intersect, Point, and Vector are used to construct root loci, discriminant sign changes, and function graphs. Ideal for high school mathematics education to understand quadratic properties and geometric interpretations of the formula.
GeoGebra Commands & Parameters
If(c < 0, "-", "+") → signccIf(c ≠ 0, signcc + absc, "") → text6If(b < 0, "-", "+") → signbbIf(a < 0, "-", "") → signaIf(a ≟ 0, "", If[absa ≟ 1, signa + "x^2", a + "x^2"]) → text5If(b ≟ 0, "", If[a ≠ 0 ∧ absb ≠ 1, signbb + absb + "x", signbb + "x"]) → text7If(b < 0, "-", "") → signbIf(c < 0, "-", "") → signcIf(a < 0, "-", "+") → signaaIf(b < 0, "(" + b + ")", "" + b) → text3If(c < 0, "(" + c + ")", "" + c) → text4If(a < 0, "(" + a + ")", "" + a) → text11If(a < 0, "(" + a + ")", "" + a) → text11_1Intersect(d, xAxis) → A, BPoint(e) → CPoint(e) → D_1Vector(C, D_1) → uPoint(f) → EPoint(f) → FVector(E, F) → vIf(Disc ∈ list1, "", ("x=" * sol_3)) → text22If(Disc ∈ list1, "", "x=" + sol_4) → text23