
Graphing Quadratic Functions by Nurazreen Mohd Tahir
Loading the math board and drawing, please wait…
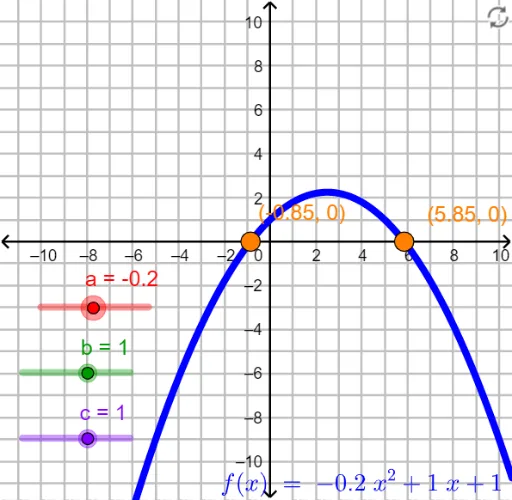
This example demonstrates how to graph quadratic functions y=ax²+bx+c and find their intersections with given points using GeoGebra. Core concepts include quadratic functions, function graphs, analytical geometry, and intersection calculations. Key GeoGebra commands and objects used are Intersect and a, b, c, f, A, B. Suitable for high school students learning about the properties and transformations of quadratic function graphs.
GeoGebra Commands & Parameters
Intersect(f, xAxis, 1) → AIntersect(f, xAxis, 2) → B
AI Drawing Prompt Reference
Draw a parabola opening upward, representing a quadratic function, intersecting the horizontal x-axis at two distinct points. First sketch the smooth curve of the parabola, ensuring it crosses the x-axis at two separate locations. Then mark two clear points at these intersections, showing their coordinates. Include coordinate axes, grid lines, and the full curve, with the intersection points prominently visible to illustrate where the quadratic function meets the x-axis.
The prompt above was compiled from the original drawing commands and is for reference only.