
Tree Diagram and Binomial Coefficients
Loading the math board and drawing, please wait…
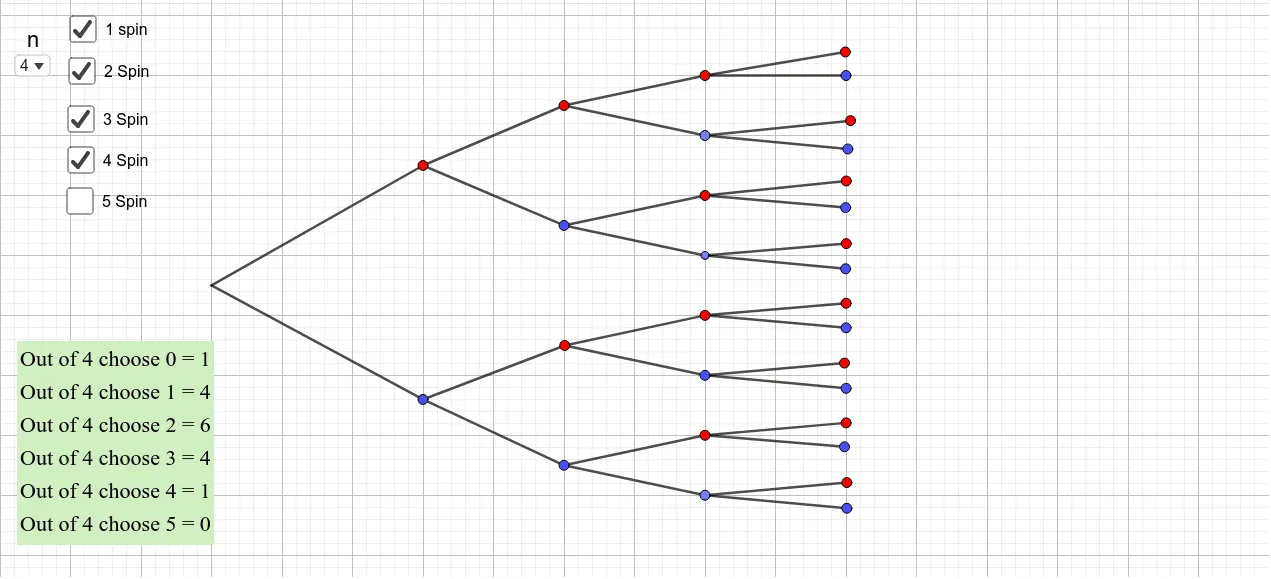
This example demonstrates the generation of binomial coefficients through a tree diagram. Key mathematical concepts include binomial distribution and probability. Using GeoGebra commands such as SelectedElement, Point, and Intersect, a dynamic tree diagram and related coefficients can be constructed. Suitable for high school mathematics education and learning probability statistics.
GeoGebra Commands & Parameters
SelectedElement(List) → n_vPoint(yAxis) → APoint(yAxis) → BPoint(yAxis) → CIntersect(xAxis, yAxis) → DPoint(yAxis) → EPoint(yAxis) → GPoint(yAxis) → HSegment(A, I) → fSegment(I, B) → gSegment(C, J) → hSegment(J, D) → iSegment(E, K) → jSegment(K, F) → kSegment(G, L) → lSegment(L, H) → mSegment(M, L) → pSegment(I, N) → qSegment(N, J) → rSegment(N, O) → sSegment(O, M) → tSegment(C, P) → aSegment(C, Q) → bSegment(D, R) → cSegment(D, S) → dSegment(E, T) → eSegment(E, U) → f_1Segment(F, V) → g_1Segment(F, W) → h_1Segment(B, Z) → i_1Segment(B, A_1) → j_1Segment(A, B_1) → k_1Segment(A, C_1) → l_1Segment(G, D_1) → m_1Segment(G, E_1) → n_1Segment(H, F_1) → p_1Segment(H, G_1) → q_1Segment(H_1, G_1) → r_1Segment(G_1, I_1) → s_1Segment(F_1, J_1) → t_1Segment(F_1, K_1) → a_1Segment(E_1, L_1) → b_1Segment(E_1, M_1) → c_1Segment(D_1, N_1) → d_1Segment(D_1, O_1) → e_1Segment(W, P_1) → f_2Segment(W, Q_1) → g_2Segment(V, R_1) → h_2Segment(V, S_1) → i_2Segment(U, T_1) → j_2Segment(U, U_1) → k_2Segment(T, V_1) → l_2Segment(T, W_1) → m_2Segment(S, Z_1) → n_2Segment(S, A_2) → p_2Segment(R, B_2) → q_2Segment(Q, C_2) → r_2Segment(Z, D_2) → s_2Segment(C_1, E_2) → t_2Segment(A_1, F_2) → a_2Segment(P, G_2) → b_2Segment(Q, H_2) → c_2Segment(R, I_2) → d_2Segment(P, J_2) → e_2Segment(A_1, K_2) → f_3Segment(Z, L_2) → g_3Segment(C_1, M_2) → h_3Segment(B_1, N_2) → i_3Segment(B_1, O_2) → j_3Binomial(n, 1) → choose1Binomial(n, 2) → choose2Segment(M, K) → k_3Binomial(n, 4) → choose4Binomial(n, 3) → choose3Binomial(n, 0) → choose0Binomial(n, 5) → choose5
AI Drawing Prompt Reference
Draw a tree diagram to illustrate the generation of binomial coefficients, featuring x and y axes with multiple points along the y-axis, connected by line segments to form a tree structure that demonstrates the geometric construction of binomial distribution and probability, building up layer by layer from the base to complete the tree diagram and related coefficient representation.
The prompt above was compiled from the original drawing commands and is for reference only.