
Trapezoidal Rule Demonstration
Loading the math board and drawing, please wait…
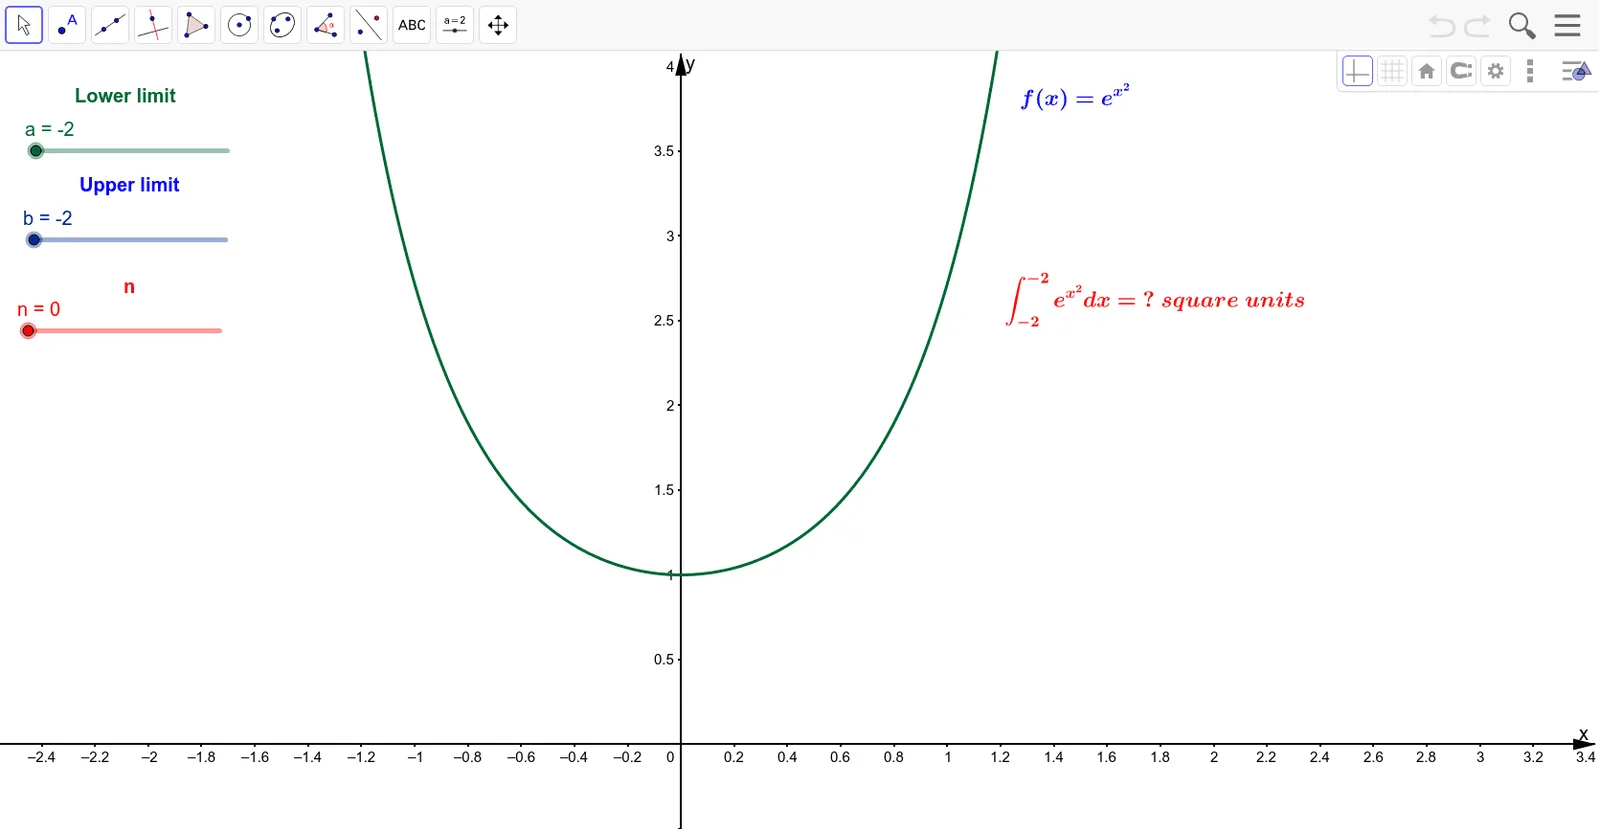
This example demonstrates the trapezoidal rule for numerical integration, showing how adjusting intervals and subdivisions affects the approximation. Key math concepts include numerical integration, trapezoidal area, function approximation, and limit concepts. GeoGebra commands used are LaTeX for formulas, TrapezoidalSum for calculation, text objects for parameters/results, and sliders for dynamic adjustments of variables like a, b, n. Suitable for high school students and calculus education.
GeoGebra Commands & Parameters
LaTeX(f, true, true) → text1TrapezoidalSum(f, a, b, n) → c
AI Drawing Prompt Reference
Draw a function graph and show how adjusting intervals and subdivisions approximates the definite integral, using differently colored lines for trapezoids of different subintervals, label the function expression, integral bounds, and number of subdivisions, dynamically adjust these parameters to observe the effect on approximation.
The prompt above was compiled from the original drawing commands and is for reference only.