
Translations of Absolute Value Graphs
Loading the math board and drawing, please wait…
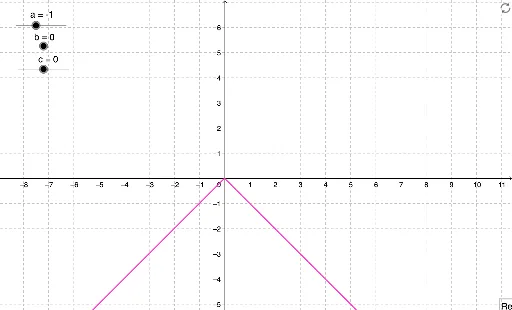
① This example demonstrates how the graph of an absolute value function translates horizontally and vertically using dynamic sliders, making the effect of parameter changes on the graph visually clear. ② The core mathematical concept is function graph translation, focusing on the absolute value function's vertex movement and the relationship between parameters and graph position. ③ Construction highlights: sliders a, b, and c control translation amounts; function f defines the absolute value expression; text objects text2, text3, and text4 display current parameter values or the function formula, updating the graph in real time. ④ Suitable for middle and high school students learning function transformations, as well as for classroom demonstrations by teachers to illustrate how translations affect graphs, laying groundwork for more advanced transformations.
GeoGebra Commands & Parameters
Numeric a(-1)Numeric b(0)Numeric c(0)f(x) = (a * abs(x - b)) + c
AI Drawing Prompt Reference
Draw a graph of an absolute value function defined as a times the absolute value of (x minus b), plus c. Include three adjustable sliders for parameters a, b, and c, with initial values of -1, 0, and 0 respectively. The graph should translate horizontally and vertically as the sliders change, with the vertex moving accordingly. Display text near the graph showing the current parameter values or the function formula, updating in real time to illustrate the effect of translations.
The prompt above was compiled from the original drawing commands and is for reference only.