
Function Transformations (y Stretch)
Loading the math board and drawing, please wait…
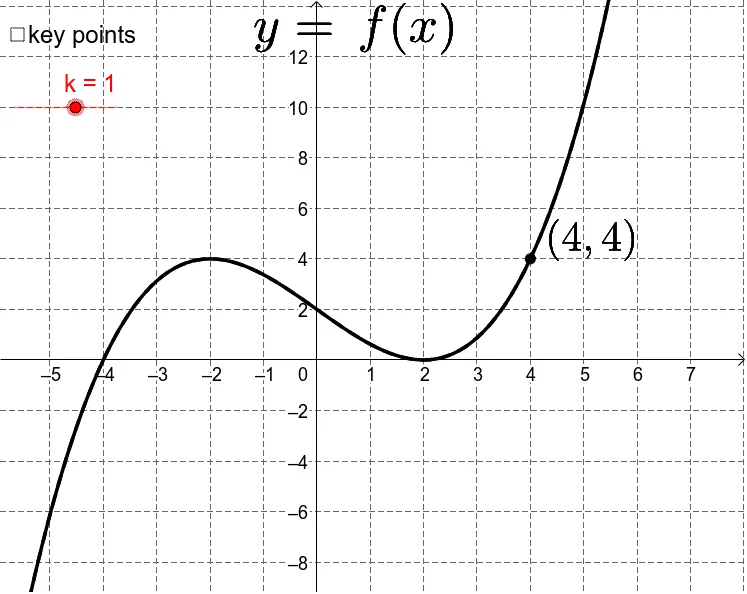
This example demonstrates the transformation of the function y=f(kx), focusing on the y-direction stretch. Key mathematical concepts include function transformation and proportionality. By adjusting parameter k, the change in the function's graph in the y-direction can be observed. The GeoGebra commands used in the construction include Extremum, Intersect, etc., for drawing the function graph and key points. Suitable for high school mathematics education and learning function transformation concepts.
GeoGebra Commands & Parameters
Extremum(f) → TPf1, TPf2Extremum(g) → TPg1, TPg2Intersect(f, yAxis) → FIntersect(g, yAxis) → GIntersect(f, xAxis) → C, C_2, D
AI Drawing Prompt Reference
Draw a function graph to demonstrate y-direction stretch transformation. First, plot the base function and the stretched function, marking the vertices of both. Then, find the intersection points of both functions with the y-axis, and the intersection points of the base function with the x-axis. Finally, connect these key points with lines to highlight the effect of the stretch on the function graph.
The prompt above was compiled from the original drawing commands and is for reference only.