
Transformations of Functions by mathspace (2)
Loading the math board and drawing, please wait…
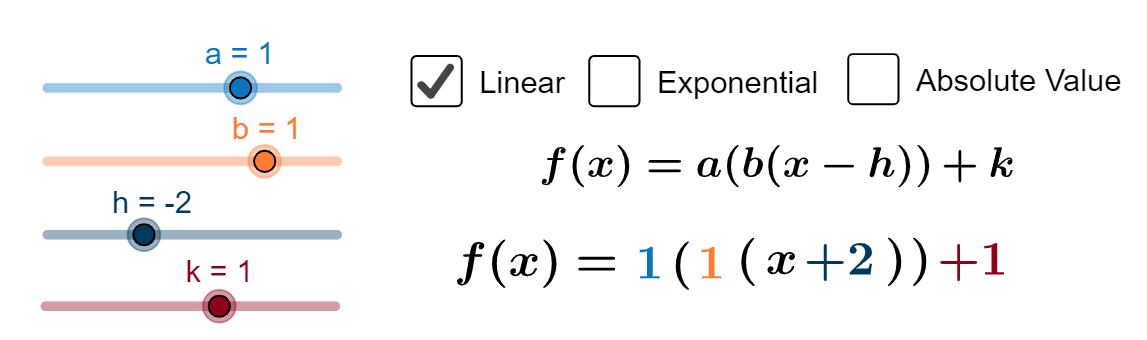
This example demonstrates transformations of function graphs including translations, scalings, and rotations. Key math concepts involved are function graph transformations, geometric transformations, and coordinate systems. GeoGebra commands like If, Vector, Distance, Corner are used to construct objects such as g, c, e, k, h, r, f, m, s, A, j, g_1, h_1, j_1, B, i, f_1, D, C, E, v, B', a, w, b, distanceEC, TextEC, button1, distanceED, F, u, distanceB'F, TextB'F, distanceBB', TextBB', d, l, G, H, n. Suitable for high school mathematics teaching to understand the properties and applications of function transformations.
GeoGebra Commands & Parameters
If(s ≟ true, (h, c + k), (h, k)) → AIf(s ≟ true, (0, 1), (0, 0)) → BIf(g ≟ true, (x(A) + 1 / e, f(x(A) + 1 / e)), If[j ≟ true, (x(A) + 1 / e, m(x(A) + 1 / e)), If[s ≟ true, (x(A) + 1 / e, r(x(A) + 1 / e))]]) → CVector(A, E) → vIf(s ≟ true, (1, 1), (1, 0)) → B'Vector(B, B') → aVector(E, C) → wDistance(E, C) → distanceECDistance(E, D) → distanceEDIf(s ≟ true, (1, 2), (1, 1)) → FVector(B', F) → uDistance(B', F) → distanceB'FDistance(B, B') → distanceBB'Vector(G, H) → nDistance(G, H) → distanceGHCorner(text8, 1) → c1Corner(text8, 2) → c2Corner(linear4, 3) → c_{linear4}Corner(linear5, 3) → c_{linear5}Corner(exp1, 3) → c_{exp1}Corner(expa, 3) → c_{expa}Corner(exp2, 3) → c_{exp2}Corner(exp3, 3) → c_{exp3}Corner(expb, 3) → c_{expb}Corner(exp4, 3) → c_{exp4}Corner(exph, 3) → c_{exph}Corner(exp5, 3) → c_{exp5}Corner(abs1, 3) → c_{abs1}Corner(absa, 3) → c_{absa}Corner(abs2, 3) → c_{abs2}Corner(absb, 3) → c_{absb}Corner(abs3, 3) → c_{abs3}Corner(absh, 3) → c_{absh}Corner(abs4, 3) → c_{abs4}
AI Drawing Prompt Reference
Draw a worked example of transformations of function graphs in a coordinate plane. Start with two baseline function graphs, then construct several transformed versions that illustrate translation, scaling, and rotation. Include key points that correspond between the original and transformed graphs, and show the relationships using direction vectors between those points and measures of distances to indicate the amount and orientation of the transformation. Add a set of auxiliary angle/vertex markers derived from lines or from intersections with several function types (e.g., polynomial, exponential, and absolute-value forms) so the viewer can compare angle positions under different transformation conditions. Combine the original graphs, all transformed curves, and the vector/distance/angle annotations in one scene for clear visual comparison.
The prompt above was compiled from the original drawing commands and is for reference only.