
Transformations of Exponential Functions by cemccourseware (2)
Loading the math board and drawing, please wait…
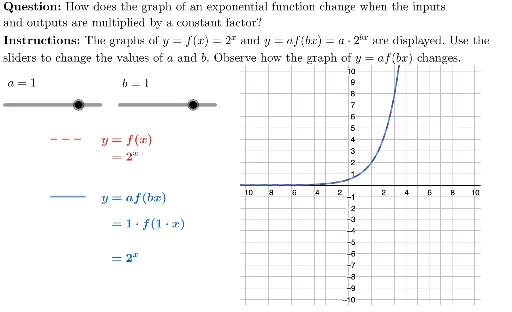
This example demonstrates the transformations of exponential function graphs, covering key math concepts like exponential function properties and transformation rules. It uses GeoGebra commands Polygon, Element, NumToImproperFrac, LaTeX, Segment for constructing function images and transformation processes, suitable for high school mathematics teaching to understand the transformation rules of exponential function graphs.
GeoGebra Commands & Parameters
Polygon((-10.5, -10.5), (-10.5, 10.5), (10.5, 10.5), (10.5, -10.5)) → viewBox, f, g, h, iElement(potentialVariableValues, b) → bValueElement(potentialVariableValues, a) → aValueNumToImproperFrac(aValue) → aValueDispNumToImproperFrac(bValue) → bValueDispLaTeX((((If[aValue ≟ 1, "", If[aValue ≟ -1, "-", (aValueDisp * "\cdot")]] * "2^{") * If[bValue ≟ 1, "", If[bValue ≟ -1, "-", bValueDisp]]) * "x}")) → imageFunctionTxtLaTeX("\text{\textbf{Question: }How does the graph of an exponential function change when the inputs\\and outputs are multiplied by a constant factor?\\\textbf{Instructions: }The graphs of \(y=f(x)=2^x\) and \(y=af(bx)=a\cdot2^{bx}\) are displayed. Use the\\sliders to change the values of \(a\) and \(b\). Observe how the graph of \(y=af(bx)\) changes.}") → TEXTSegment(LegendAnchor, LegendAnchor + (3, 0)) → fxLegendSegment(LegendAnchor + (0, -5), LegendAnchor + (3, -5)) → afxLegend