
Time Series Analysis Applet
Loading the math board and drawing, please wait…
In collections
Charts & Graphs
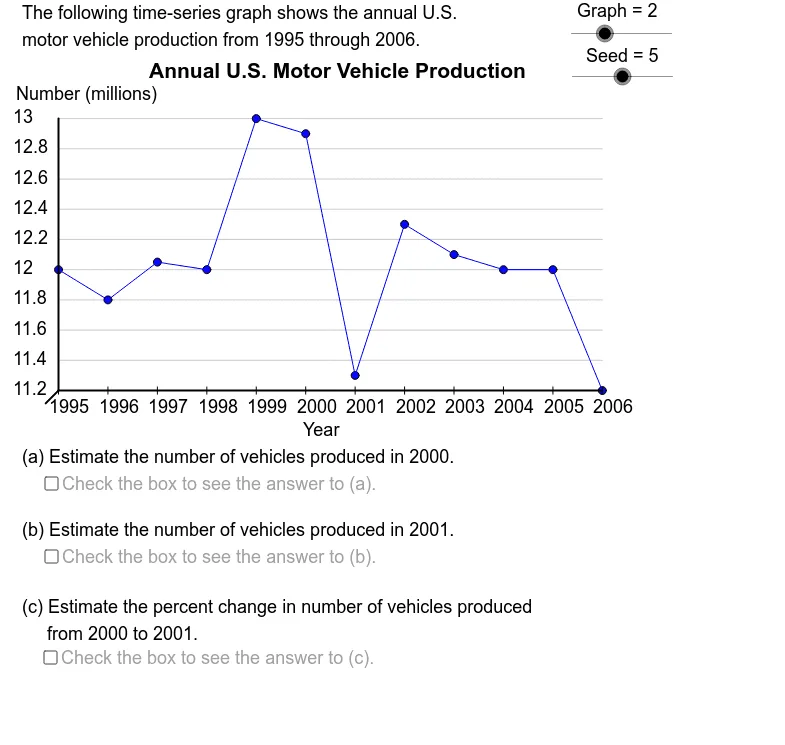
This example demonstrates various time series graphs and challenges students to estimate the percentage change between given time periods. It involves core mathematical concepts such as statistics, straight lines, exponential functions, and random variables. The construction utilizes GeoGebra commands like Element, CountIf, Max, Min, If, Sequence, Segment, Text, and objects including GrBt, GrLf, DtY19, etc. It is suitable for high school students and mathematicians studying time series analysis and related topics.
GeoGebra Commands & Parameters
Element(DtYSq, Graph) → DtYCountIf(x ≠ (0, 0), DtY) → SizeMax(DtY) → YDtMxMin(DtY) → YDtMnIf((5 * LBSY) ≤ UBSY, (5 * LBSY), If[(2 * LBSY) ≤ UBSY, (2 * LBSY), LBSY]) → YSclSequence(Mod[2 + (5 * k), Size - 1] + 1, k, 1, Size - 1) → OpSqElement(OpSq, Seed) → OptElement(DtY, Opt + 1) → Val2Element(DtY, Opt) → Val1Element(DtXSq, Graph) → DtXSegment((-1.414, -1.414), (0, 0)) → llsgSegment(GrBL, GrBR) → haxSegment(GrBL, GrTL) → vaxSequence((((k - 1) * XScl), AdpY(Element[DtY, k])), k, 1, Size) → PtSqElement(VTtSq, Graph) → VL2Element(DDSq, Graph) → DDElement(TtSq, Graph) → TitleElement(DtX, Opt) → Time1Element(DtX, Opt + 1) → Time2Element(SbSq, Graph) → SubjectElement(UntSq, Graph) → UnitIf(Val1 < Val2, "increase", If[Val1 > Val2, "decrease", "change"]) → DirSequence(Segment[Element[PtSq, k - 1], Element[PtSq, k]], k, 2, Size) → SgSqSequence(Segment[((k * XScl), (-0.4)), ((k * XScl), 0.4)], k, 0, Size - 1) → XTcSqIf(Graph ≟ 4, "the ", "") → ArticleIf(Graph ≟ 1 ∧ ((Opt < 5) ∨ (Opt > 7)), "", ".") → Punc1If(Graph ≟ 1 ∧ ((Opt < 4) ∨ (Opt > 6)), "", ".") → Punc2Sequence(Segment[(0, AdpY(k)), (GrRt, AdpY(k))], k, YAxMn, YAxMx, YScl) → HGrdsSequence(Text[k, ((-5), AdpY(k) - 0.5)], k, YAxMn, YAxMx, YScl) → YLbSqSequence(Text[Element[DtX, k], (((k - 1) * XScl) - 1, (-2.5))], k, 1, Size) → XLbSqText(Element[HTtSq, Graph], (27, -5)) → HLb
AI Drawing Prompt Reference
Create a time series analysis graph showing data points and trends. Include X and Y axes with time labels on the X-axis and numerical values on the Y-axis. Draw lines connecting the data points to illustrate trends, using different colors or markers to indicate increases and decreases. Add a title and descriptive text below the graph, noting the data source and units.
The prompt above was compiled from the original drawing commands and is for reference only.