
Three Graphics Views: f(x), f'(x), and f''(x) Side-by-Side
Loading the math board and drawing, please wait…
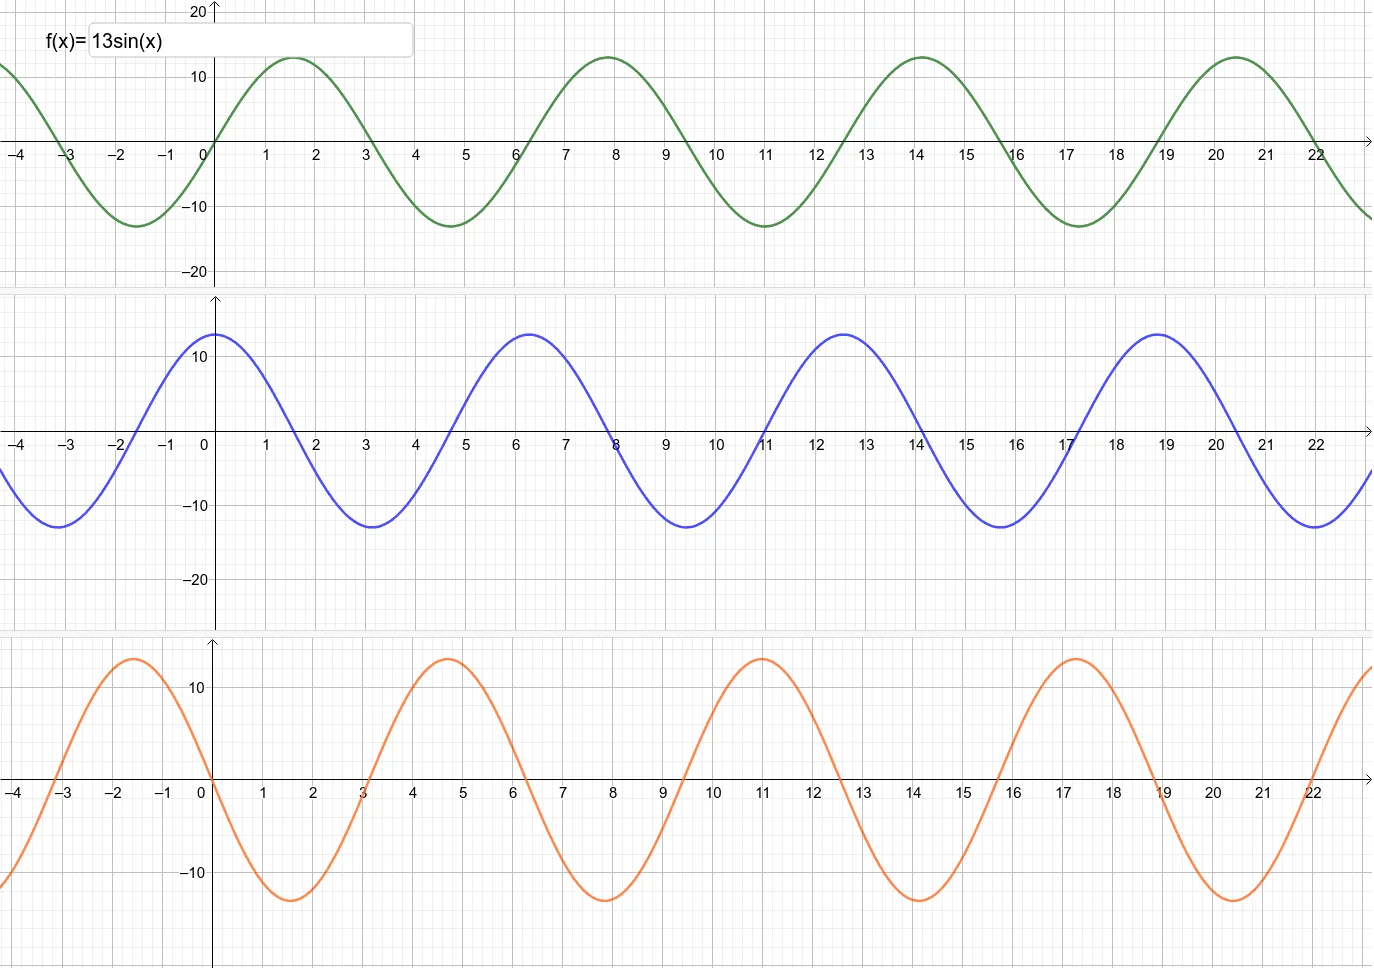
① This example uses three side-by-side graphics views to simultaneously display a function f(x), its first derivative f'(x), and its second derivative f''(x), allowing direct visual comparison of the original function and its derivatives. ② Core mathematical concepts include derivatives, function graphs, extrema, inflection points, and how the sign of derivatives affects monotonicity and concavity. ③ Construction highlights: The GeoGebra command Textfield creates a text input box, defining an object a (representing f(x)); the derivatives f'(x) and f''(x) are automatically generated; InputBox1 lets users dynamically edit the function expression, and three separate Graphics Views are bound to display each function. ④ Suitable for high school to early college students learning calculus, this example serves as an interactive demonstration for classroom teaching or self-study, and can be a template for building dynamic calculus lessons.
GeoGebra Commands & Parameters
Textfield(f) → InputBox1
AI Drawing Prompt Reference
Draw a graph showing the function f(x), its first derivative f'(x), and second derivative f''(x) side-by-side. The graph should illustrate the function's behavior, extrema, and inflection points, and explain how the sign of the derivatives affects monotonicity and concavity.
The prompt above was compiled from the original drawing commands and is for reference only.