
The Sound of Sine, Part 2: Audio Wave Visualization and Mathematical Analysis
Loading the math board and drawing, please wait…
In collections
The Sound of Sine
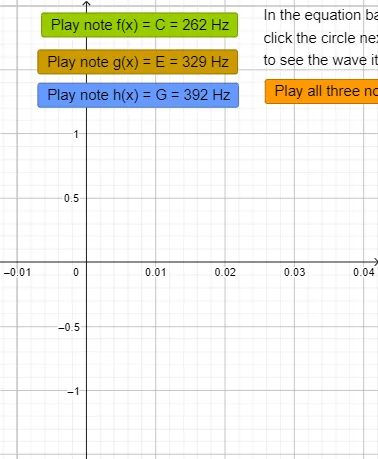
This example demonstrates the interactive visualization and analysis of sine wave sounds through GeoGebra, revealing the mathematical nature of audio. Core mathematical concepts include trigonometric functions (sine waves), calculus (area calculations), logarithmic functions (frequency analysis), and statistical histograms (amplitude distribution). Construction details: Using button1-button5 for playback control and parameter adjustment, defining functions f, g, h, j to represent sine waves with different frequencies or phases, displaying real-time analysis data via text3, and enabling dynamic waveform changes through sliders or buttons. Suitable for high school to university-level mathematics, physics, and music mathematics courses, useful for teaching wave superposition, introduction to Fourier analysis, and mathematical representation of sound.
GeoGebra Commands & Parameters
f(x) = sin((((2 * π) * 262) * x))g(x) = sin((((2 * π) * 329) * x))h(x) = sin((((2 * π) * 392) * x))j(x) = sin((((2 * π) * 262) * x)) + sin((((2 * π) * 329) * x)) + sin((((2 * π) * 392) * x))
AI Drawing Prompt Reference
Draw a graph showing multiple sine waves with different frequencies. Display the superposition of these waves and their amplitude distribution. Use sliders to adjust frequency and phase, observing changes in the waveform. The graph should clearly show the shapes of individual waves and the overall waveform after superposition, suitable for math and physics teaching.
The prompt above was compiled from the original drawing commands and is for reference only.