
The Sound of Sine, Part 1: Dynamic Secant Lines and Symmetry
Loading the math board and drawing, please wait…
In collections
The Sound of Sine
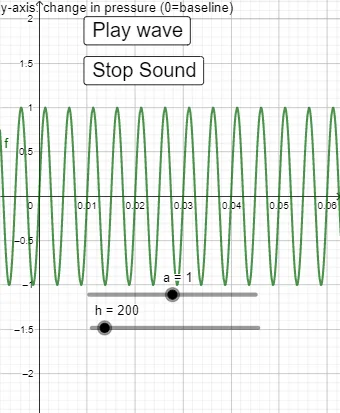
This interactive GeoGebra example demonstrates how a secant line on the sine function moves dynamically as parameters change, revealing connections between the function's symmetry, dilation, and the slope of the secant. Core mathematical concepts include periodicity of sine, slope variation of secant lines, symmetry axes of the graph, and vertical stretching transformations. Construction details: two buttons (button1, button2) control animation start/stop, sliders (a, h) adjust function parameters and secant position, function object (f) defines the sine curve, and text objects (text1, text2) display current values and explanations. Suitable for high school or early college students learning trigonometric functions, transformations, and introductory derivative concepts, also useful as a visual aid for exploring how secants approach tangents.
GeoGebra Commands & Parameters
Numeric a(1)Numeric h(200)f(x) = (a * sin((((2 * π) * h) * x)))
AI Drawing Prompt Reference
Draw a dynamic illustration showing how a secant line on a sine function moves as parameters change, revealing connections between the function's symmetry, dilation, and the slope of the secant. The graph features a sine curve, two sliders to adjust function parameters and secant position, two buttons to control animation start/stop, and two text objects displaying current values and explanations.
The prompt above was compiled from the original drawing commands and is for reference only.