
Sine Function Sandbox Demo: Graph and Construction
Loading the math board and drawing, please wait…
In collections
The Sound of Sine
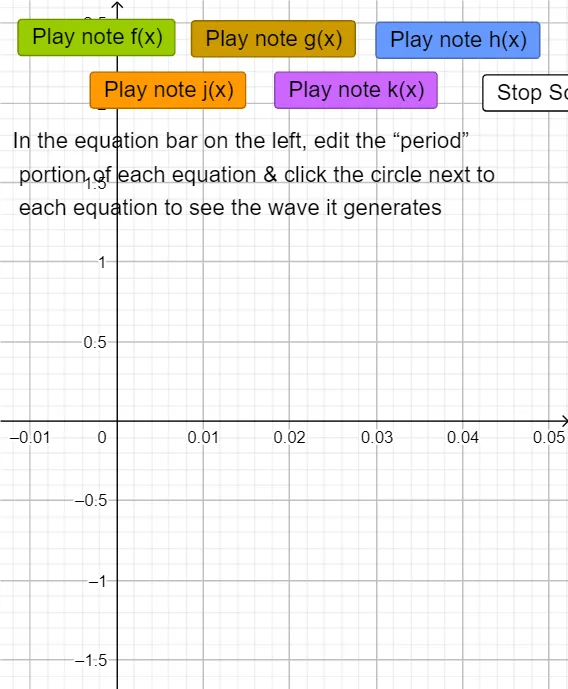
This example demonstrates the graphical representation of the sine function in a sandbox environment. The key mathematical concepts involved include trigonometry, the unit circle, and geometric construction. Construction involves using GeoGebra commands such as button1, button2, f, g, button3, h, button4, button5, text3, j, k, button6. It is suitable for middle or high school mathematics learning to understand the dynamic behavior and geometric significance of the sine function.
GeoGebra Commands & Parameters
f(x) = sin((((2 * π) * 261) * x))g(x) = sin((((2 * π) * 329) * x))h(x) = sin((((2 * π) * 392) * x))j(x) = sin((((2 * π) * 100) * x)) + sin((((2 * π) * 150) * x))k(x) = sin((((2 * π) * 500) * x)) + (2 / 5 * sin((((2 * π) * 200) * x)))
AI Drawing Prompt Reference
Draw three sine waves with different frequencies in a coordinate system to show their amplitude and period variations, and combine two sine waves of different frequencies to form composite waveforms, observing the dynamic behavior and geometric significance of the sine function through parameter adjustments, suitable for middle or high school mathematics learning.
The prompt above was compiled from the original drawing commands and is for reference only.