
Investigating the Tangent Graph: Asymptotes and Tangent Lines
Loading the math board and drawing, please wait…
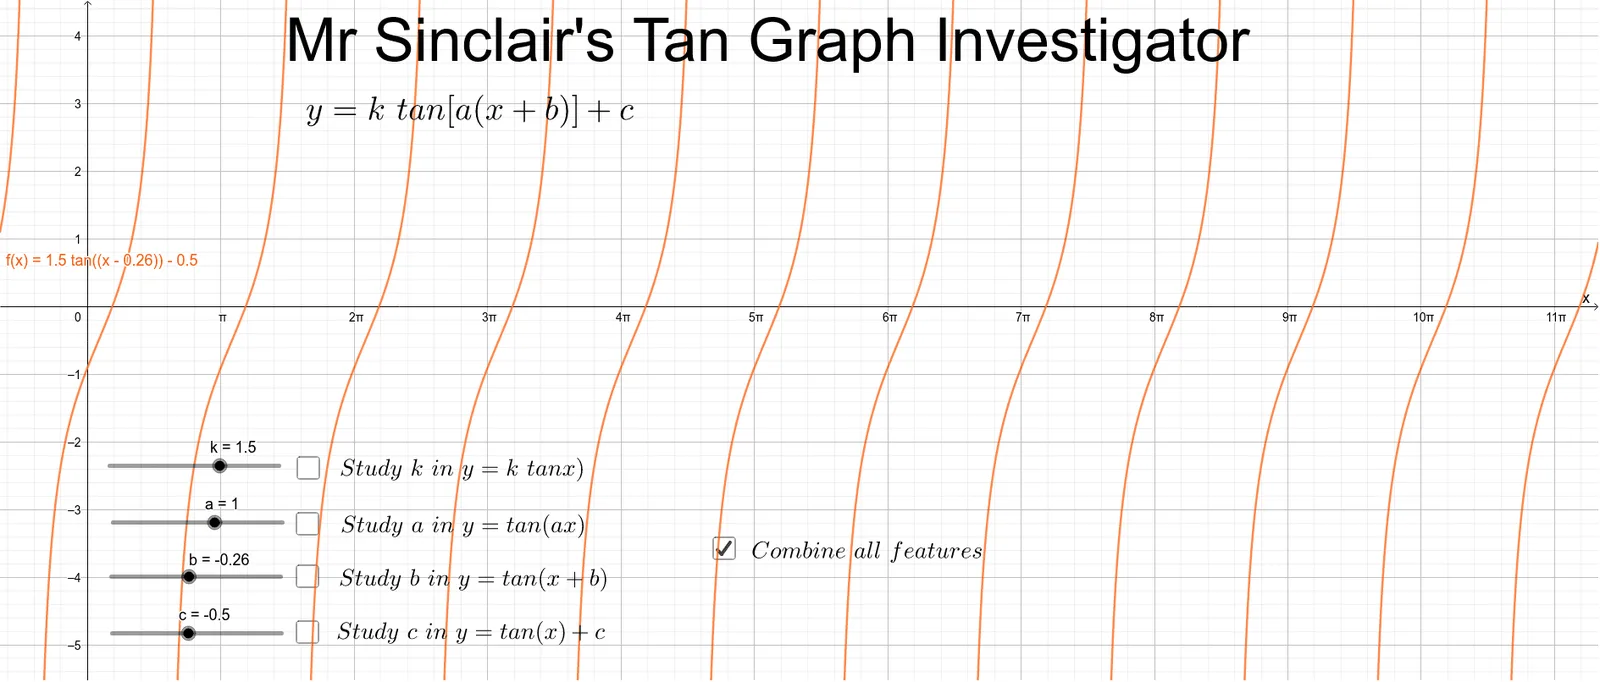
This GeoGebra example demonstrates how the tangent function y = tan(x) behaves across different intervals, using the geometry of tangents and the presence of vertical asymptotes to visualize discontinuity and divergence near π/2 + kπ. It highlights key ideas from trigonometry: trigonometric functions and their periodicity, the unit-circle interpretation of angles, and tangent-line (touching) reasoning. The construction also emphasizes piecewise behavior and inequality/interval restrictions to focus on specific x-ranges. In GeoGebra, the figure is built from parameter and auxiliary objects (e.g., k, b, c, a, d, e and related labeled text objects such as text1, text2, text3_1/text3_2/text3_3, text4, text3). It links angle-related constructs (i, j, l) with graphing elements (objects like f, g, h, p, q) to display the tangent graph and its key geometric features. Suitable for high school and early university students studying functions, trigonometry, and as a bridge toward differential calculus concepts.
GeoGebra Commands & Parameters
Numeric k(1.5)Numeric b(-0.2617993877991496)Numeric c(-0.5)Numeric a(1.0)Boolean d(false)Boolean e(false)Boolean i(false)Boolean j(false)Boolean l(true)f(x) = (k * tan((a * (x + b)))) + cg(x) = (k * tan(x))h(x) = tan((a * x))p(x) = tan(x + b)q(x) = tan(x) + c
AI Drawing Prompt Reference
Draw a graph of the tangent function, showing its behavior across different intervals. The graph should include vertical asymptotes (e.g., x = π/2 + kπ) and tangent lines. Key objects include parameters k, b, c, a and graph elements f, g, h, p, q. These objects are linked through angle-related constructs (e.g., l) to display the geometric features of the tangent function. The construction order starts with setting parameters, then building graph elements, and finally adding text annotations.
The prompt above was compiled from the original drawing commands and is for reference only.