
The Sine Function and the Unit Circle
Loading the math board and drawing, please wait…
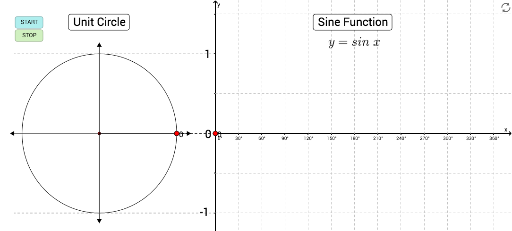
This interactive GeoGebra example visualizes the geometric relationship between the sine function and the unit circle, demonstrating how the sine value corresponds to the vertical projection of a rotating radius. Core mathematical concepts include the unit circle definition of trigonometric functions, sine function, angle measurement in radians, and function graphing. Construction details: the Circle command creates the unit circle, a Point moves along the circle, a Segment connects the center to the moving point, an Angle marks the rotation, and a Function plots the sine curve. A slider controls the angle, while Intersect, Midpoint, and other commands link the circle's sine segment to the corresponding point on the graph. Suitable for high school and introductory college students learning trigonometry, function transformations, or pre-calculus, and useful for classroom demonstrations or self-exploration of periodicity, amplitude, and phase shifts.
GeoGebra Commands & Parameters
Circle(A, 100) → cPoint(c) → BSegment((x(B), 0), B) → aSegment(A, B) → bPoint(xAxis) → DPoint(xAxis) → ESegment(D, E) → dSegment(F, G) → eMidpoint(a) → HIntersect(c, d) → I, JCircleArc(A, J, B) → gAngle(J, A, B) → αAngle(B, C, A) → βFunction((100 * sin(x°)), 0, 360) → hSegment(L, K) → iSegment(B, L) → jMidpoint(i) → MMidpoint(b) → NSegment(O, P) → kSegment(Q, R) → l
AI Drawing Prompt Reference
Draw a unit circle with a point moving along its circumference. Connect the center to this point with a line segment, and draw the vertical projection of this segment to the x-axis, forming another line segment. Mark the angle between the center and the moving point, and plot the sine of this angle as a function graph ranging from 0 to 360 degrees. Use a slider to control the angle and connect the vertical projection point on the circle to the corresponding point on the function graph.
The prompt above was compiled from the original drawing commands and is for reference only.