
The Normal Distribution Curve by Robin Tunley
Loading the math board and drawing, please wait…
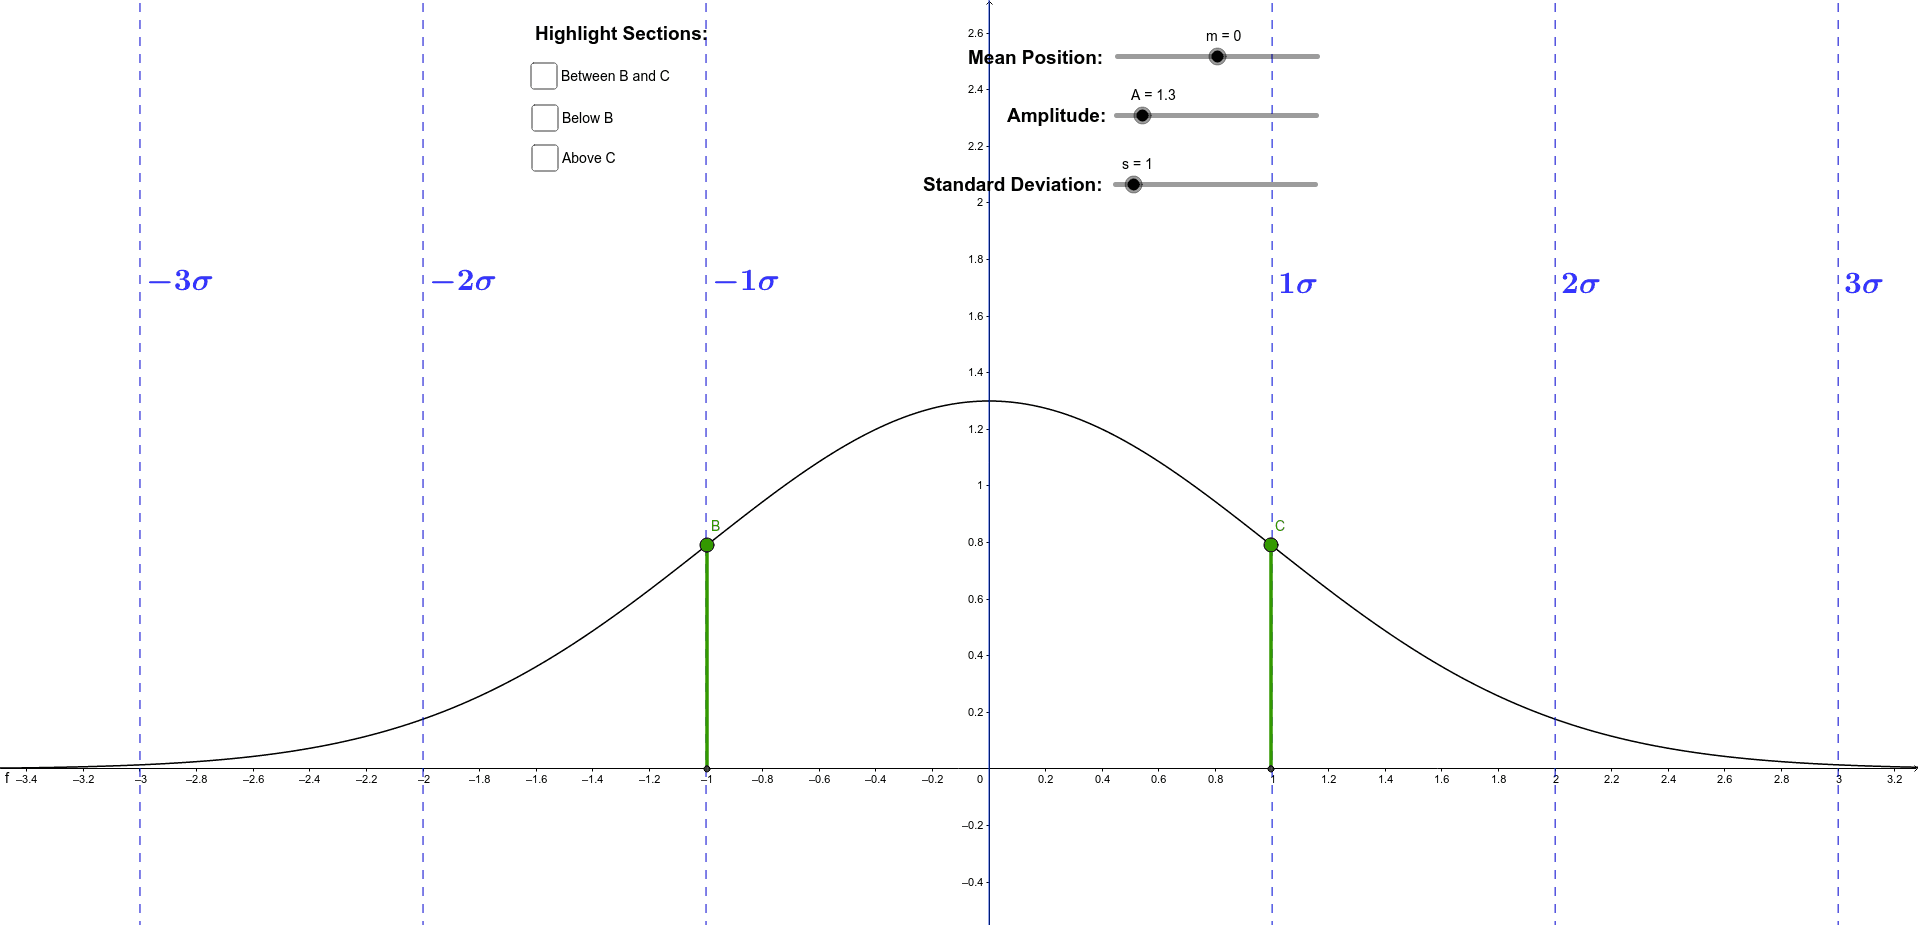
This interactive GeoGebra worksheet demonstrates the Gaussian (normal) distribution curve, allowing students to dynamically adjust the mean, amplitude, and standard deviation to observe how these parameters reshape the bell curve. Core mathematical concepts include the probability density function, the role of mean as location parameter, standard deviation as scale parameter, the area under the curve computed via definite integrals, and connections to binomial distribution and trigonometric functions. The construction uses commands such as Point, Segment, and Integral, with objects including the mean point m, standard deviation s, amplitude a, interval endpoints B and C, and multiple text labels for probabilities. Sliders enable real-time parameter changes)Skip. This resource is ideal for high school and undergraduate statistics or probability courses, helping students grasp the 68-95-99.7 rule, probability intervals, and the geometric interpretation of integration.
GeoGebra Commands & Parameters
Point(f) → BPoint(f) → CSegment(P1, B) → lSegment(P2, C) → nIntegral(f, x(B), x(C)) → oIntegral(f, (-100 * s), x(B)) → pIntegral(f, x(C), (100 * s)) → q
AI Drawing Prompt Reference
Draw a Gaussian distribution curve with adjustable mean, amplitude, and standard deviation, showing the mean point, standard deviation line, and integral areas, controlled by sliders, and label the 68-95-99.7 rule probability intervals, start with the curve and two integral areas, then connect the mean point to the areas, and finally label the probability values.
The prompt above was compiled from the original drawing commands and is for reference only.