
The Derivative
Loading the math board and drawing, please wait…
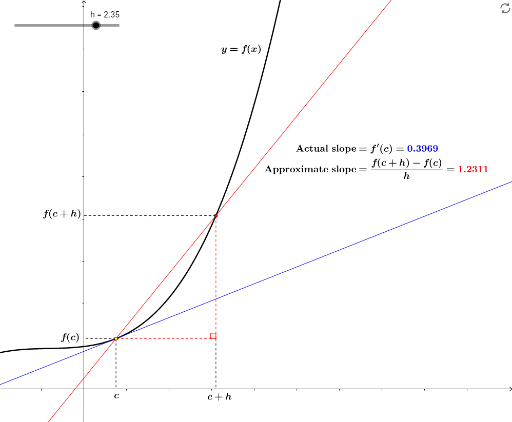
This example illustrates the concept of a derivative. By observing the rate of change of a function's graph, it helps understand the geometric meaning of a derivative. It uses commands like Sequence, Line, Segment, and Angle in GeoGebra for construction. Suitable for high school mathematics education and learning derivative concepts.
GeoGebra Commands & Parameters
Sequence((1 + (k * Δ), f(1 + (k * Δ))), k, 0, h - 1, 1) → list1Line(A, B) → gSegment((x(B), y(A)), B) → jSegment((x(B), y(A)), A) → kAngle(j, k) → αSegment(A, (x(A), 0)) → lSegment((x(B), y(A)), (x(B), 0)) → mSegment(A, (0, y(A))) → nSegment((0, y(B)), B) → p
AI Drawing Prompt Reference
Draw a function graph and connect a series of points on it to form a curve, illustrating the rate of change of the function. Then, draw line segments from these points to the function graph, construct multiple angles, and measure one of them to visually demonstrate the geometric meaning of the derivative. Finally, add auxiliary line segments perpendicular to the x-axis and y-axis to form right triangles, aiding in understanding the definition of the derivative.
The prompt above was compiled from the original drawing commands and is for reference only.