
The Derivative as a Function: Dynamic Tangent and Slope Visualization
Loading the math board and drawing, please wait…
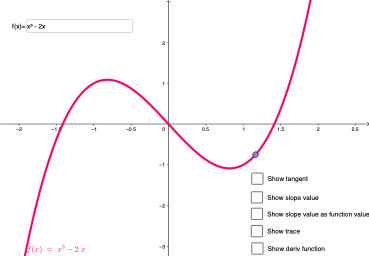
This GeoGebra example dynamically illustrates the derivative as a function by showing how the slope m of the tangent line at a moving point A on a function f traces out the derivative function f'. The core mathematical concept is the geometric interpretation of the derivative—the slope of the tangent—and its relationship to the original function. Construction highlights include using the Derivative command to generate f', Point to place a movable point on the curve, Tangent and Slope to draw the tangent line and compute its slope, Segment to connect relevant points, and Textfield input boxes for interactive modification of the function or parameters. Suitable for high school and early college students learning calculus, this tool helps build an intuitive understanding of how the derivative transitions from an instantaneous rate of change to a full function graph, and serves as an effective classroom demonstration for teachers.
GeoGebra Commands & Parameters
Derivative(f) → f'Point(f) → ATangent(A, f) → aSlope(a) → mSegment(C, B) → bSegment(D, E) → cTextfield(f) → InputBox1Textfield(A) → InputBox2