
Exploring R-squared
Loading the math board and drawing, please wait…
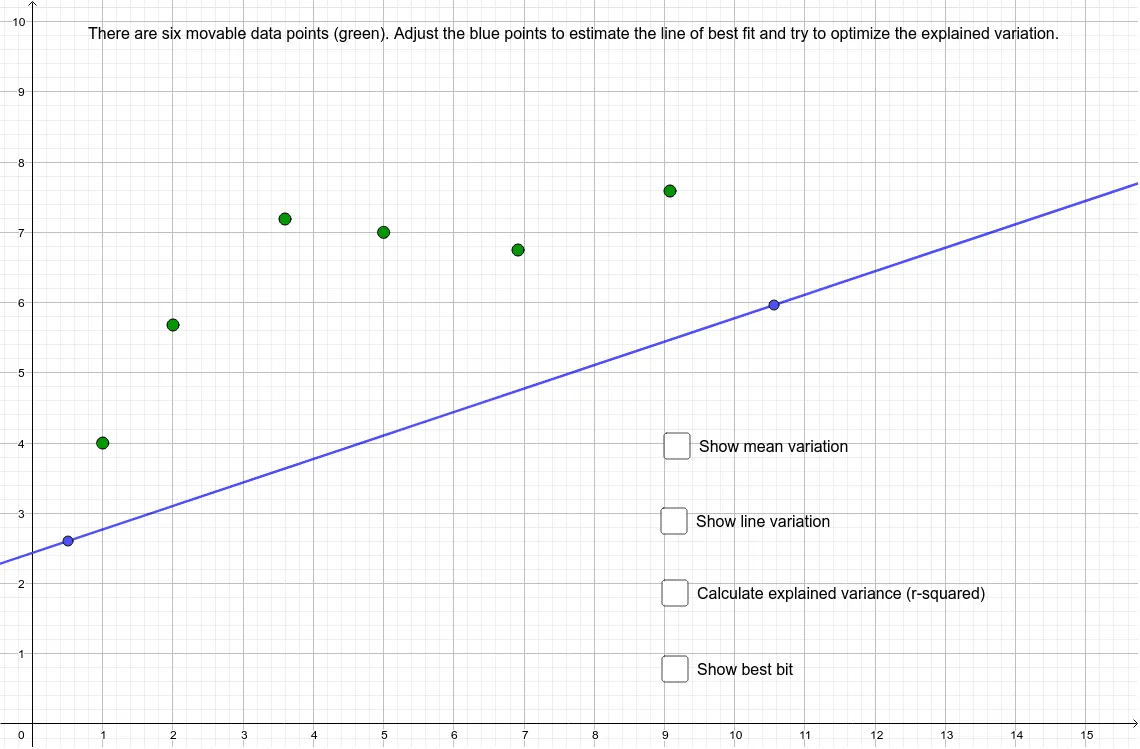
This example demonstrates the concept of R-squared, a measure of how well a linear regression model fits the data. Through the commands and objects in the construction summary, one can visually understand the calculation and significance of R-squared. The core mathematical concepts include linear regression, correlation coefficient, and variance. Suitable for high school mathematics education and learning.
GeoGebra Commands & Parameters
Max(A1:A20) → aMax(B1:B20) → bmean(B1:B20) → cMin(A1:A20) → dSegment((d, c), (a, c)) → fLine(A, B) → gPolygon(E1, D1, G1, H1) → q1, f1, c1, h1, i1Polygon(E2, D2, G2, H2) → q2, f2, c2, h2, i2Polygon(D3, E3, H3, G3) → q3, c3, f3, i3, h3Polygon(D4, E4, H4, G4) → q4, c4, f4, i4, h4Polygon(D5, G5, H5, E5) → q5, c5, h5, i5, f5Polygon(E6, H6, G6, D6) → q6, f6, i6, h6, c6Polygon(D1, K1, L1, I1) → q7, h, l1, m1, j1Polygon(D2, K2, L2, I2) → q8, i, l2, m2, j2Polygon(D3, I3, L3, K3) → q9, j, j3, m3, l3Polygon(D4, I4, L4, K4) → q10, k, j4, m4, l4Polygon(I5, L5, K5, D5) → q11, j5, m5, l5, lPolygon(I6, L6, K6, D6) → q12, j6, m6, l6, mFitLineY({D1, D2, D3, D4, D5, D6}) → rPMCC({D1, D2, D3, D4, D5, D6}) → sSum(F10:F15) → F16Sum(J10:J15) → J16
AI Drawing Prompt Reference
Draw a coordinate system with data points and a fitted line to illustrate the concept of R-squared in regression analysis. First, plot multiple polygons representing data points, then draw a horizontal segment for the mean of y, fit a best-fit line, calculate the correlation coefficient, and combine the polygons and line to visualize the concept.
The prompt above was compiled from the original drawing commands and is for reference only.