
Temperature vs. Time Simulation by harrytomalley
Loading the math board and drawing, please wait…
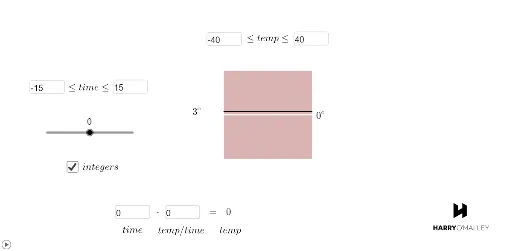
This example demonstrates the simulation of temperature changes over time, visualizing data trends through graphical representations. Key math concepts include function graphs, multiplication, equilateral triangles, interest calculations, LCM and GCD, and integer operations. Construction highlights involve commands like Polygon, Textfield, Segment, and If in GeoGebra, along with objects such as hrate, rate, and poly1. Suitable for high school mathematics education, focusing on the application of function modeling combined with geometric constructions.
GeoGebra Commands & Parameters
Polygon(A, B, 4) → poly1, f, g, h, i, C, DTextfield(cmin) → InputBox1Textfield(cmax) → InputBox2Textfield(a) → InputBox3Textfield(outputmin) → InputBox4Textfield(outputmax) → InputBox5Textfield(p) → InputBox6Segment(E, F) → jTextfield(a) → InputBox3_1Textfield(outputmin) → InputBox4_1Textfield(outputmax) → InputBox5_1Segment(E_1, F_1) → j_1Polygon(A_1, B_1, 4) → poly1_1, f_1, g_1, h_1, i_1, C_1, D_1Textfield(a) → InputBox3_2Textfield(outputmin) → InputBox4_2Textfield(outputmax) → InputBox5_2Textfield(a) → InputBox3_3Textfield(outputmin) → InputBox4_3Textfield(outputmax) → InputBox5_3Textfield(a) → InputBox3_4Textfield(outputmin) → InputBox4_4Textfield(outputmax) → InputBox5_4Textfield(a) → InputBox3_5Textfield(outputmin) → InputBox4_5Textfield(outputmax) → InputBox5_5Textfield(a) → InputBox3_6Textfield(outputmin) → InputBox4_6Textfield(outputmax) → InputBox5_6Textfield(a) → InputBox3_7Textfield(outputmin) → InputBox4_7Textfield(outputmax) → InputBox5_7If(ZeroToOne < 94 / 256, 255, 94 / 256 ≤ ZeroToOne ≤ 210 / 256, ((-2.198 * (ZeroTo256 - 210))) / 256, ZeroToOne > 210 / 256, 0) → blueIf(ZeroToOne < 37 / 256, 0, 37 / 256 ≤ ZeroToOne ≤ 179 / 256, (48.845 * (ZeroTo256 - 37)^(1 / 3) / 256), ZeroToOne > 179 / 256, 1) → redIf(ZeroToOneTwo < 94 / 256, 255, 94 / 256 ≤ ZeroToOneTwo ≤ 210 / 256, ((-2.198 * (ZeroTo256Two - 210))) / 256, ZeroToOneTwo > 210 / 256, 0) → blue2If(ZeroToOneTwo < 37 / 256, 0, 37 / 256 ≤ ZeroToOneTwo ≤ 179 / 256, (48.845 * (ZeroTo256Two - 37)^(1 / 3) / 256), ZeroToOneTwo > 179 / 256, 1) → red2Textfield(rate) → InputBox7Segment(E_2, F_2) → kSegment(E_2, H) → l
AI Drawing Prompt Reference
Create a simulation interface showing temperature changes over time, with multiple input fields for parameters like temperature range and rate. Include a square region filled with red-blue gradient bands generated by piecewise functions to represent temperature levels. Add line segments connecting points to indicate time or temperature trends. The layout combines repeated input boxes and segments, forming a control panel alongside a visualization area, emphasizing function graphs and geometric constructions.
The prompt above was compiled from the original drawing commands and is for reference only.