
Temperature vs. Time - Multiplication by harrytomalley (3)
Loading the math board and drawing, please wait…
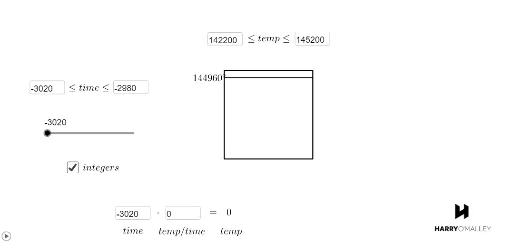
This example demonstrates the relationship between temperature and time, involving multiplication. Using GeoGebra commands such as Polygon, Textfield, and Segment, the temperature vs. time graph is constructed. Suitable for middle school and above students to learn multiplication and function graphs.
GeoGebra Commands & Parameters
Polygon(A, B, 4) → poly1, f, g, h, i, C, DTextfield(cmin) → InputBox1Textfield(cmax) → InputBox2Textfield(a) → InputBox3Textfield(outputmin) → InputBox4Textfield(outputmax) → InputBox5Textfield(p) → InputBox6Segment(E, F) → jTextfield(a) → InputBox3_1Textfield(outputmin) → InputBox4_1Textfield(outputmax) → InputBox5_1Segment(E_1, F_1) → j_1Polygon(A_1, B_1, 4) → poly1_1, f_1, g_1, h_1, i_1, C_1, D_1Textfield(a) → InputBox3_2Textfield(outputmin) → InputBox4_2Textfield(outputmax) → InputBox5_2Textfield(a) → InputBox3_3Textfield(outputmin) → InputBox4_3Textfield(outputmax) → InputBox5_3Textfield(a) → InputBox3_4Textfield(outputmin) → InputBox4_4Textfield(outputmax) → InputBox5_4Textfield(a) → InputBox3_5Textfield(outputmin) → InputBox4_5Textfield(outputmax) → InputBox5_5Textfield(a) → InputBox3_6Textfield(outputmin) → InputBox4_6Textfield(outputmax) → InputBox5_6Textfield(a) → InputBox3_7Textfield(outputmin) → InputBox4_7Textfield(outputmax) → InputBox5_7If(ZeroToOne < 94 / 256, 255, 94 / 256 ≤ ZeroToOne ≤ 210 / 256, ((-2.198 * (ZeroTo256 - 210))) / 256, ZeroToOne > 210 / 256, 0) → blueIf(ZeroToOne < 37 / 256, 0, 37 / 256 ≤ ZeroToOne ≤ 179 / 256, (48.845 * (ZeroTo256 - 37)^(1 / 3) / 256), ZeroToOne > 179 / 256, 1) → redIf(ZeroToOneTwo < 94 / 256, 255, 94 / 256 ≤ ZeroToOneTwo ≤ 210 / 256, ((-2.198 * (ZeroTo256Two - 210))) / 256, ZeroToOneTwo > 210 / 256, 0) → blue2If(ZeroToOneTwo < 37 / 256, 0, 37 / 256 ≤ ZeroToOneTwo ≤ 179 / 256, (48.845 * (ZeroTo256Two - 37)^(1 / 3) / 256), ZeroToOneTwo > 179 / 256, 1) → red2Textfield(rate) → InputBox7Segment(E_2, F_2) → kSegment(E_2, H) → l
AI Drawing Prompt Reference
Draw a function graph showing temperature vs. time, involving multiple polygons and segments, controlled by sliders, with different colors to distinguish regions, illustrating the relationship between temperature and time, suitable for middle school students learning functions and coordinate geometry.
The prompt above was compiled from the original drawing commands and is for reference only.