
Temperature vs. Time - Multiplication - Sim to Sim - Non 2
Loading the math board and drawing, please wait…
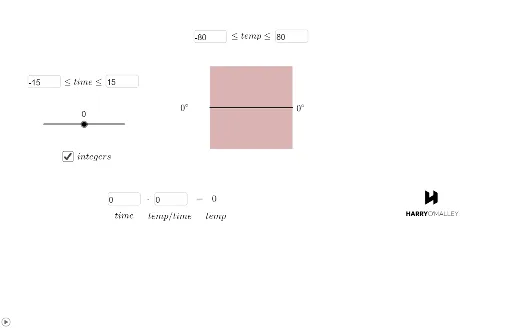
① This interactive GeoGebra example demonstrates how temperature changes over time under a multiplicative model, using similarity transformations to compare different simulation curves (Sim to Sim). ② Core mathematical concepts include multiplication functions, similarity transformations, curve sketching, logarithmic functions, confidence intervals, and set theory elements, enabling multi-variable interaction. ③ Construction highlights: uses commands such as Polygon, Segment, and If to build shapes and conditional logic; employs Textfield and multiple InputBoxes (InputBox1 to InputBox6) for user-defined parameters like rate and hrate; objects include polygons (poly1), functions (f, g, h, i, j), points (A, B, C, D, E, F), and range limits (cmax, cmin) to control output. ④ Suitable for high school to early college students, this resource supports exploration of multiplicative models and similarity in temperature simulation, and serves as a dynamic tool for math modeling or function graphing lessons.
GeoGebra Commands & Parameters
Polygon(A, B, 4) → poly1, f, g, h, i, C, DTextfield(cmin) → InputBox1Textfield(cmax) → InputBox2Textfield(a) → InputBox3Textfield(outputmin) → InputBox4Textfield(outputmax) → InputBox5Textfield(p) → InputBox6Segment(E, F) → jTextfield(a) → InputBox3_1Textfield(outputmin) → InputBox4_1Textfield(outputmax) → InputBox5_1Segment(E_1, F_1) → j_1Polygon(A_1, B_1, 4) → poly1_1, f_1, g_1, h_1, i_1, C_1, D_1Textfield(a) → InputBox3_2Textfield(outputmin) → InputBox4_2Textfield(outputmax) → InputBox5_2Textfield(a) → InputBox3_3Textfield(outputmin) → InputBox4_3Textfield(outputmax) → InputBox5_3Textfield(a) → InputBox3_4Textfield(outputmin) → InputBox4_4Textfield(outputmax) → InputBox5_4Textfield(a) → InputBox3_5Textfield(outputmin) → InputBox4_5Textfield(outputmax) → InputBox5_5Textfield(a) → InputBox3_6Textfield(outputmin) → InputBox4_6Textfield(outputmax) → InputBox5_6Textfield(a) → InputBox3_7Textfield(outputmin) → InputBox4_7Textfield(outputmax) → InputBox5_7If(ZeroToOne < 94 / 256, 255, 94 / 256 ≤ ZeroToOne ≤ 210 / 256, ((-2.198 * (ZeroTo256 - 210))) / 256, ZeroToOne > 210 / 256, 0) → blueIf(ZeroToOne < 37 / 256, 0, 37 / 256 ≤ ZeroToOne ≤ 179 / 256, (48.845 * (ZeroTo256 - 37)^(1 / 3) / 256), ZeroToOne > 179 / 256, 1) → redIf(ZeroToOneTwo < 94 / 256, 255, 94 / 256 ≤ ZeroToOneTwo ≤ 210 / 256, ((-2.198 * (ZeroTo256Two - 210))) / 256, ZeroToOneTwo > 210 / 256, 0) → blue2If(ZeroToOneTwo < 37 / 256, 0, 37 / 256 ≤ ZeroToOneTwo ≤ 179 / 256, (48.845 * (ZeroTo256Two - 37)^(1 / 3) / 256), ZeroToOneTwo > 179 / 256, 1) → red2Textfield(rate) → InputBox7Segment(E_2, F_2) → kSegment(E_2, H) → l
AI Drawing Prompt Reference
Create a graph demonstrating temperature changes over time under a multiplicative model with multiple similarity-transformed simulation curves. Use polygons, segments, and conditional logic to construct shapes, sliders to control parameters like rate and range, and different colors to distinguish confidence intervals, suitable for exploring multiplicative models and similarity in temperature simulation.
The prompt above was compiled from the original drawing commands and is for reference only.