
Transformations of Function Graphs (I)
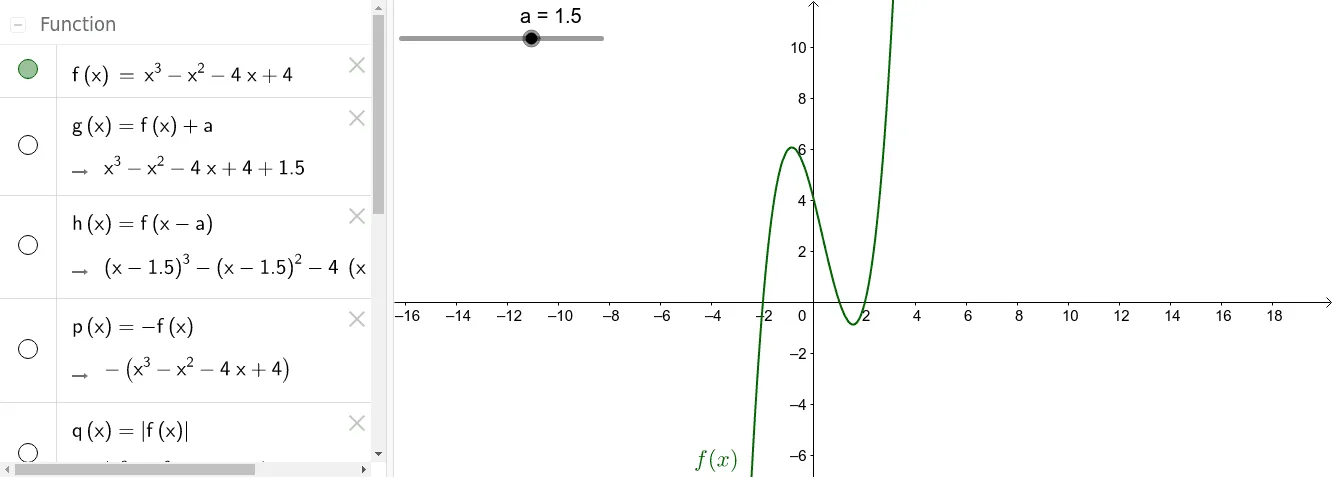
This example illustrates how the graph of a basic function changes under parameter variations, demonstrating geometric transformations such as translations and scalings. It covers core mathematical concepts including linear functions, regions defined by inequalities, and functional transformations in the coordinate plane. The construction uses several GeoGebra objects: base function f, slider a, derived functions g and h, and points p, q, r, s, t to dynamically control and visualize transformations in real time. Suitable for middle to high school mathematics instruction, especially for introducing function transformations and coordinate geometry.
Loading the math board and drawing, please wait…