
Temperature vs. Time Simulation by harrytomalley (4)
Loading the math board and drawing, please wait…
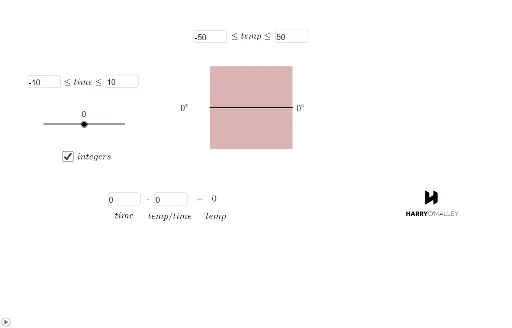
This example demonstrates the dynamic visualization of temperature changes over time. It involves core math concepts like function graphing, differential equations, trigonometry, and polygon construction. Key GeoGebra commands and objects used include Polygon, Textfield, Segment, and If for creating shapes, displaying text, drawing segments, and implementing conditional logic. Suitable for high school and above students to explore function modeling, differential equations, and parameterized animations.
GeoGebra Commands & Parameters
Polygon(A, B, 4) → poly1, f, g, h, i, C, DTextfield(cmin) → InputBox1Textfield(cmax) → InputBox2Textfield(a) → InputBox3Textfield(outputmin) → InputBox4Textfield(outputmax) → InputBox5Textfield(p) → InputBox6Segment(E, F) → jTextfield(a) → InputBox3_1Textfield(outputmin) → InputBox4_1Textfield(outputmax) → InputBox5_1Segment(E_1, F_1) → j_1Polygon(A_1, B_1, 4) → poly1_1, f_1, g_1, h_1, i_1, C_1, D_1Textfield(a) → InputBox3_2Textfield(outputmin) → InputBox4_2Textfield(outputmax) → InputBox5_2Textfield(a) → InputBox3_3Textfield(outputmin) → InputBox4_3Textfield(outputmax) → InputBox5_3Textfield(a) → InputBox3_4Textfield(outputmin) → InputBox4_4Textfield(outputmax) → InputBox5_4Textfield(a) → InputBox3_5Textfield(outputmin) → InputBox4_5Textfield(outputmax) → InputBox5_5Textfield(a) → InputBox3_6Textfield(outputmin) → InputBox4_6Textfield(outputmax) → InputBox5_6Textfield(a) → InputBox3_7Textfield(outputmin) → InputBox4_7Textfield(outputmax) → InputBox5_7If(ZeroToOne < 94 / 256, 255, 94 / 256 ≤ ZeroToOne ≤ 210 / 256, ((-2.198 * (ZeroTo256 - 210))) / 256, ZeroToOne > 210 / 256, 0) → blueIf(ZeroToOne < 37 / 256, 0, 37 / 256 ≤ ZeroToOne ≤ 179 / 256, (48.845 * (ZeroTo256 - 37)^(1 / 3) / 256), ZeroToOne > 179 / 256, 1) → redIf(ZeroToOneTwo < 94 / 256, 255, 94 / 256 ≤ ZeroToOneTwo ≤ 210 / 256, ((-2.198 * (ZeroTo256Two - 210))) / 256, ZeroToOneTwo > 210 / 256, 0) → blue2If(ZeroToOneTwo < 37 / 256, 0, 37 / 256 ≤ ZeroToOneTwo ≤ 179 / 256, (48.845 * (ZeroTo256Two - 37)^(1 / 3) / 256), ZeroToOneTwo > 179 / 256, 1) → red2Textfield(rate) → InputBox7Segment(E_2, F_2) → kSegment(E_2, H) → l
AI Drawing Prompt Reference
Create a dynamic temperature vs. time graph with multiple quadrilaterals and text input boxes. Start by drawing a quadrilateral to represent the temperature change area, then add six text input boxes to control the quadrilateral's parameters, colors, and display ranges. Next, draw two line segments to indicate the temperature change boundaries, and finally use conditional statements to set color changes.
The prompt above was compiled from the original drawing commands and is for reference only.