
Geometric Meaning of Derivatives of Sine and Cosine Functions
Loading the math board and drawing, please wait…
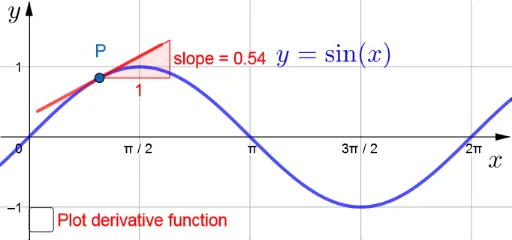
This GeoGebra example dynamically demonstrates the geometric interpretation of derivatives for sine and cosine functions. What it shows: Displays the graphs of y=sin x and y=cos x, visually presents the derivative as the slope of tangent lines by using secant line approximation, making the concept of derivative intuitive and clear. Mathematical concepts covered: Definition of derivative, limit concept, relationship between secant and tangent lines, derivative formulas of sine and cosine (d/dx sin x = cos x, d/dx cos x = -sin x). Construction details: Uses Point command to create key points, Segment command to draw secant line segments, Slope command to calculate slope values, displays function expressions and slope numbers through text objects, with slider controlling the secant position for dynamic animation. Target audience: Suitable for high school calculus introduction or university-level calculus courses, also useful for math competition training to strengthen the integration of algebraic and geometric thinking.
GeoGebra Commands & Parameters
Point(f) → PSegment(A, B) → hSlope(Line[P, B]) → slopeSegment(P, C) → i
AI Drawing Prompt Reference
Draw the graphs of sine and cosine, place a draggable point on the sine curve, join it with another fixed point on the curve to form a secant segment, show the slope of the line through the moving point and a second point, and draw a segment from the moving point to a third point; the construction updates with a slider so the secant approaches the tangent, illustrating the derivative as the slope of the tangent.
The prompt above was compiled from the original drawing commands and is for reference only.