
Visualizing Hyperbolic Sine/Cosine as Coordinates on a Hyperbola
Loading the math board and drawing, please wait…
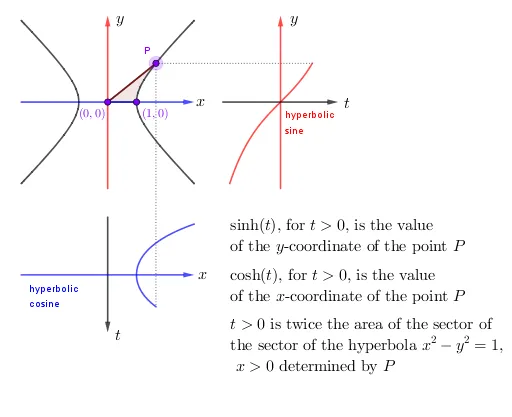
This example demonstrates a geometric interpretation of hyperbolic functions by using (hyperbolic cosine, hyperbolic sine) as the coordinates of a point on a hyperbola. As the parameter varies, the construction reveals the associated hyperbolic sector and how its boundary relates to the chosen parameterized point and curve. Key math ideas include the hyperbolic sine sinh and hyperbolic cosine cosh, parameterization of conic sections, and the connection to calculus tools (optionally using integrals) for quantifying the sector’s measure. In GeoGebra, the model is built with commands such as Point, Segment, Polygon, and CurveCartesian to create the hyperbola and the sector region, while Vector supports parameter-driven point/vector depiction. Integral is used together with function/equation objects (e.g., f, g, eq1 and related intermediate objects) to link hyperbolic-function expressions to computed quantities. Labeling via text objects (text2–text10 and similar) highlights the key parameters and relationships. Suitable for advanced high school through early undergraduate audiences studying analytic geometry and introductory calculus, especially for dynamic visualization and understanding geometric meaning of hyperbolic functions.
GeoGebra Commands & Parameters
Point(eq1) → PSegment(A, P) → hPolygon(A, C, P) → t1, p, a, cIntegral(f, 1, x(P)) → bSegment((1, 0), (x(P), 0)) → iSegment((0, 0), (1, 0)) → jVector((-3, 0), (3, 0)) → uVector((0, -3), (0, 3)) → vIntegral(g, 1, x(P)) → dVector((6, -3), (6, 3)) → wVector((4, 0), (8, 0)) → eVector((0, -4), (0, -8)) → kVector((-3, -6), (3, -6)) → lCurveCartesian(u + 6, sinh(u), u, asinh((-sqrt(8))), t) → mCurveCartesian(cosh(u), (-u) - 6, u, asinh((-sqrt(8))), t) → oSegment(P, (t + 6, y(P))) → f_1Segment(P, (x(P), (-t) - 6)) → g_1
AI Drawing Prompt Reference
Visualize a hyperbola using hyperbolic cosine and sine as coordinates for a moving point. Draw the line from the point to the origin and form a sector. Add integral segments linking hyperbolic functions to the sector's area. Include horizontal and vertical vectors to denote axes. Finally, plot the parameterized curve of the hyperbola and connect the point to corresponding points on the curve to illustrate the relationship between the hyperbolic sector and the parameter.
The prompt above was compiled from the original drawing commands and is for reference only.