
Temperature vs. Time Graph with Thermometer Display
Loading the math board and drawing, please wait…
In collections
Introduction to Linear Functions and Graphs
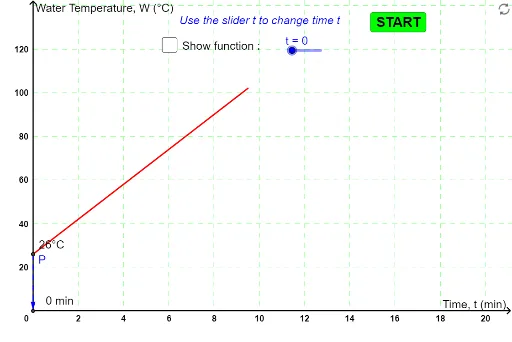
① This applet demonstrates the linear increase of water temperature under constant heating, visualized both as a function graph and an animated thermometer. ② The core mathematical concept is a linear function: temperature rises proportionally to time, T(t) = kt + T₀, illustrating slope, direct proportionality, and dependent variables. ③ Construction uses GeoGebra commands such as Circle, Intersect, Vector, Point, Segment, Polygon, and Textfield to build the coordinate system, function graph, thermometer scale, and interactive controls; sliders or buttons adjust time, updating the thermometer level and the point on the graph dynamically. ④ Suitable for middle or high school students learning about functions, linear relationships, and graphical representation, and for cross-disciplinary teaching with physics (heat).
GeoGebra Commands & Parameters
Circle((0, -8), 14) → cIntersect(c, xAxis) → A, BVector(P, P_{xaxis}) → uVector(P, P_{yaxis}) → vPoint(c) → CCircumcircleArc(A, C, B) → dSegment(A, A_t) → aSegment(B, B_t) → bPoint(yAxis) → DCircle(D, B_t) → eIntersect(e, yAxis, 2) → EPolygon(A_{tb}, B_{tb}, B_{tt}, A_{tt}) → poly1, i, j, k, lCircumcircleArc(A_t, E, B_t) → gCircle((0, -8), 8) → hSegment((0, 0), P_{therm}) → themometerlineTextfield(textFunction) → InputBox1
AI Drawing Prompt Reference
Draw a coordinate plane with horizontal axis for time and vertical axis for temperature. Place a vertical circular thermometer to the left of the vertical axis, with its bottom below the origin and its scale aligned with the axis. In the plane, draw a straight line starting from the origin and extending upward to the right, representing temperature rising linearly with time. Put a movable point on this line, corresponding to the current time and temperature. From this point, draw perpendicular dashed lines to both axes, marking the projections. Fill the thermometer's tube up to the height matching the point's vertical coordinate. Next to the thermometer, show an input box for entering a time value. The whole figure illustrates the linear relationship between temperature and time.
The prompt above was compiled from the original drawing commands and is for reference only.