
Tape Diagrams in Algebra (with examples) by artipal81 (3)
Loading the math board and drawing, please wait…
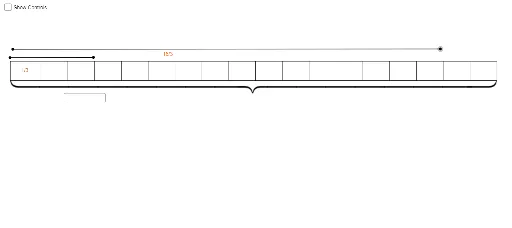
This example demonstrates how tape diagrams can be used to visualize and solve algebraic problems. It involves core math concepts like algebraic operations, ratios, and geometric intuition. GeoGebra commands and objects such as Textfield, Polygon, Point, Segment, Midpoint, and Sequence are utilized to construct interactive visualizations. Suitable for middle school and above students learning algebra, especially for understanding visual representations of abstract concepts.
GeoGebra Commands & Parameters
Textfield(m) → InputBox1Textfield(text5) → InputBox2Textfield(n) → InputBox3Textfield(text6) → InputBox4Textfield(text7) → InputBox5Polygon(A, B, C, D) → poly1, a_1, b, c, dPoint(poly1) → ESegment(E, F) → fMidpoint(D, F) → GMidpoint(F, C) → HSequence(Segment[A + ((i_1 * (k - 1)), 0), A + ((i_1 * (k - 1)), h)], k, 1, m) → list1Sequence(Segment[E + ((i_2 * (p - 1)), 0), E + ((i_2 * (p - 1)), h)], p, 1, n) → list2Sequence(Segment[A + ((i_3 * (k - 1)), 0), A + ((i_3 * (k - 1)), h)], k, 1, m) → list3Sequence(Text[text6, (x(E) + (r * i_2) + i_2 / (n + 1), 0.7)], r, 0, n - 1) → list2tSequence(Text[text5, (x(A) + (q * i_3) + i_3 / (m + 1), 0.7)], q, 0, m - 1) → list3tSequence(Text[text5, (x(A) + (q * i_1) + i_1 / (m + 1), 0.7)], q, 0, m - 1) → list1tSegment(N, O) → jSegment(I, M) → i
AI Drawing Prompt Reference
Create a tape diagram consisting of two rectangles divided into equal vertical segments to represent an algebraic equation. Each rectangle is split into a variable number of sections, with text labels inside each section showing numbers or variables. Add input boxes and sliders to control the number of segments. Place the rectangles side by side or aligned to show the relationship between the two sides of the equation. Include labels above or within the diagram to indicate the variables and constants.
The prompt above was compiled from the original drawing commands and is for reference only.