
Tape Diagrams in Algebra (with examples) by artipal81 (2)
Loading the math board and drawing, please wait…
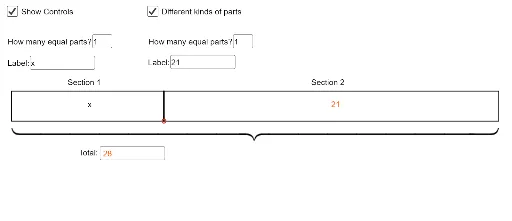
This example demonstrates how tape diagrams are used in algebra to visualize problems, making quantitative relationships clear through geometric representation. Key math concepts include algebraic operations, proportional reasoning, and geometric intuition. It is constructed using GeoGebra commands like Textfield, Polygon, Point, Segment, Midpoint, and Sequence to build the tape diagram model, suitable for middle school students and above learning algebra or introductory probability statistics.
GeoGebra Commands & Parameters
Textfield(m) → InputBox1Textfield(text5) → InputBox2Textfield(n) → InputBox3Textfield(text6) → InputBox4Textfield(text7) → InputBox5Polygon(A, B, C, D) → poly1, a_1, b, c, dPoint(poly1) → ESegment(E, F) → fMidpoint(D, F) → GMidpoint(F, C) → HSequence(Segment[A + ((i_1 * (k - 1)), 0), A + ((i_1 * (k - 1)), h)], k, 1, m) → list1Sequence(Segment[E + ((i_2 * (p - 1)), 0), E + ((i_2 * (p - 1)), h)], p, 1, n) → list2Sequence(Segment[A + ((i_3 * (k - 1)), 0), A + ((i_3 * (k - 1)), h)], k, 1, m) → list3Sequence(Text[text6, (x(E) + (r * i_2) + i_2 / (n + 1), 0.7)], r, 0, n - 1) → list2tSequence(Text[text5, (x(A) + (q * i_3) + i_3 / (m + 1), 0.7)], q, 0, m - 1) → list3tSequence(Text[text5, (x(A) + (q * i_1) + i_1 / (m + 1), 0.7)], q, 0, m - 1) → list1t
AI Drawing Prompt Reference
Create a tape diagram to represent an algebraic problem. First, input the values for m and n to define the length and width of the diagram. Then, draw a rectangle and divide it into m equal segments and n equal segments. Label each segment with the corresponding value. Finally, add text to explain the meaning of each segment.
The prompt above was compiled from the original drawing commands and is for reference only.