
Tape Diagrams for Algebra (with examples)
Loading the math board and drawing, please wait…
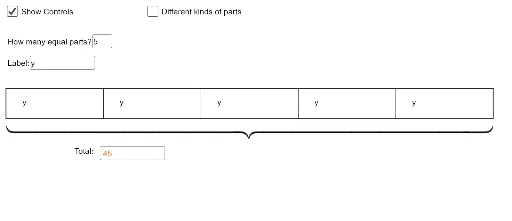
① This interactive GeoGebra example demonstrates how tape diagrams (bar models) can visually represent algebraic equations, showing the relationship between unknown variables and known quantities through proportional segments. ② Core mathematical concepts include algebraic equations, variables, ratio, and the visual balance of both sides of an equation. ③ Construction highlights: uses Textfield and InputBox components for dynamic input, Polygon, Segment, Midpoint, and Sequence commands to draw the segmented bars, and Point objects to create adjustable geometry that updates in real time. ④ Ideal for middle and high school students learning introductory algebra, and for teachers to illustrate the transition from concrete visual models to abstract symbolic reasoning.
GeoGebra Commands & Parameters
Textfield(m) → InputBox1Textfield(text5) → InputBox2Textfield(n) → InputBox3Textfield(text6) → InputBox4Textfield(text7) → InputBox5Polygon(A, B, C, D) → poly1, a_1, b, c, dPoint(poly1) → ESegment(E, F) → fMidpoint(D, F) → GMidpoint(F, C) → HSequence(Segment[A + ((i_1 * (k - 1)), 0), A + ((i_1 * (k - 1)), h)], k, 1, m) → list1Sequence(Segment[E + ((i_2 * (p - 1)), 0), E + ((i_2 * (p - 1)), h)], p, 1, n) → list2Sequence(Segment[A + ((i_3 * (k - 1)), 0), A + ((i_3 * (k - 1)), h)], k, 1, m) → list3Sequence(Text[text6, (x(E) + (r * i_2) + i_2 / (n + 1), 0.7)], r, 0, n - 1) → list2tSequence(Text[text5, (x(A) + (q * i_3) + i_3 / (m + 1), 0.7)], q, 0, m - 1) → list3tSequence(Text[text5, (x(A) + (q * i_1) + i_1 / (m + 1), 0.7)], q, 0, m - 1) → list1t
AI Drawing Prompt Reference
Draw a tape diagram for an algebraic equation model with two adjustable sliders m and n to control the length and width of the diagram. Use input boxes to enter unknown variables and known quantities, and represent proportional relationships with segmented lines to show the balance of the equation. First, create input boxes for m and n, then draw a rectangle, followed by drawing segmented lines inside the rectangle, and finally add text labels to display the input variables.
The prompt above was compiled from the original drawing commands and is for reference only.