
Tape Diagrams for Algebra (with examples) by artipal81
Loading the math board and drawing, please wait…
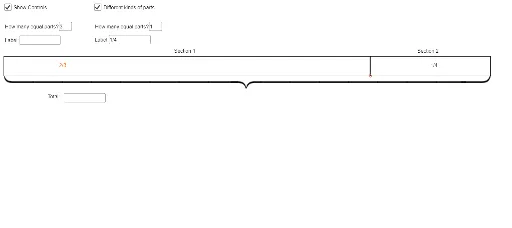
This GeoGebra example demonstrates how tape diagrams (bar models) can visually represent algebraic relationships, turning abstract equations into intuitive geometric models. It covers core math concepts such as algebraic expressions, equations, proportions, arithmetic operations, median value, and the connection between area and segment lengths. The construction uses GeoGebra commands including Textfield, Polygon, Point, Segment, Midpoint, and Sequence, along with interactive input boxes (InputBox) and dynamic objects (g, e, m, n, poly1, etc.) that update the diagram in real time as users enter values. Suitable for middle and high school algebra instruction, this resource helps students grasp equation modeling and quantitative comparison, and serves as a versatile tool for classroom demonstrations or independent exploration.
GeoGebra Commands & Parameters
Textfield(m) → InputBox1Textfield(text5) → InputBox2Textfield(n) → InputBox3Textfield(text6) → InputBox4Textfield(text7) → InputBox5Polygon(A, B, C, D) → poly1, a_1, b, c, dPoint(poly1) → ESegment(E, F) → fMidpoint(D, F) → GMidpoint(F, C) → HSequence(Segment[A + ((i_1 * (k - 1)), 0), A + ((i_1 * (k - 1)), h)], k, 1, m) → list1Sequence(Segment[E + ((i_2 * (p - 1)), 0), E + ((i_2 * (p - 1)), h)], p, 1, n) → list2Sequence(Segment[A + ((i_3 * (k - 1)), 0), A + ((i_3 * (k - 1)), h)], k, 1, m) → list3Sequence(Text[text6, (x(E) + (r * i_2) + i_2 / (n + 1), 0.7)], r, 0, n - 1) → list2tSequence(Text[text5, (x(A) + (q * i_3) + i_3 / (m + 1), 0.7)], q, 0, m - 1) → list3tSequence(Text[text5, (x(A) + (q * i_1) + i_1 / (m + 1), 0.7)], q, 0, m - 1) → list1t