
Tape Diagrams for Algebra (with examples) by Jillian011291
Loading the math board and drawing, please wait…
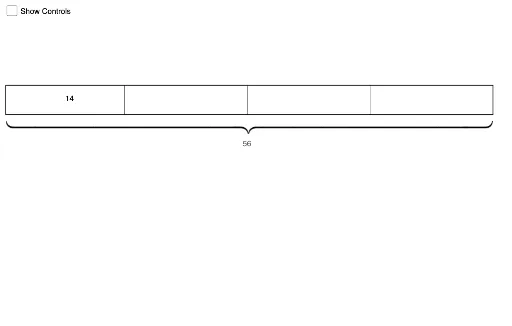
This GeoGebra example demonstrates how tape diagrams (bar models) can visualize algebraic relationships, helping solve equations, proportions, and percentage problems. The core mathematical concepts include algebraic expressions, equality, ratios, percentages, and graphical modeling. Construction details: it uses Textfield and InputBox for interactive data entry, Polygon to draw the tape bars, Point, Segment, and Midpoint to build the geometric structure, and Sequence to generate repeated bars. Variables (a, b, c, d) and lists (list1, etc.) enable dynamic adjustments. Suitable for middle and high school algebra instruction, this tool aids students in grasping abstract algebraic concepts through visual representation, and is ideal for teachers creating interactive lessons or students exploring algebraic problem-solving. It integrates algebra with geometry, embodying the idea of combining numbers with shapes, and serves as a powerful educational visualization.
GeoGebra Commands & Parameters
Textfield(m) → InputBox1Textfield(text5) → InputBox2Textfield(n) → InputBox3Textfield(text6) → InputBox4Polygon(A, B, C, D) → poly1, a_1, b, c, dPoint(poly1) → ESegment(E, F) → fMidpoint(D, F) → GMidpoint(F, C) → HSequence(Segment[A + ((i_1 * (k - 1)), 0), A + ((i_1 * (k - 1)), h)], k, 1, m) → list1Sequence(Segment[E + ((i_2 * (p - 1)), 0), E + ((i_2 * (p - 1)), h)], p, 1, n) → list2Sequence(Segment[A + ((i_3 * (k - 1)), 0), A + ((i_3 * (k - 1)), h)], k, 1, m) → list3Sequence(Text[text6, (x(E) + (r * i_2) + i_2 / (n + 1), 0.7)], r, 0, n - 1) → list2tSequence(Text[text5, (x(A) + (q * i_3) + i_3 / (m + 1), 0.7)], q, 0, m - 1) → list3tSequence(Text[text5, (x(A) + (q * i_1) + i_1 / (m + 1), 0.7)], q, 0, m - 1) → list1tSegment(I, L) → i
AI Drawing Prompt Reference
Draw a bar model for algebra teaching. Start with a large rectangle, then divide it horizontally into several equal smaller bars, with the number adjustable. Place two input boxes above or beside the rectangle for entering numbers and text labels. Each small bar can contain a text label representing a variable or value. Additionally, draw another set of similar bars below or on the other side to represent another expression or proportional relationship. All bars have equal width and height, arranged neatly. The overall layout is clear, making it easy to compare both sides of an equation and understand algebraic equations, ratios, and percentages.
The prompt above was compiled from the original drawing commands and is for reference only.