
Tape Diagrams for Fractions
Loading the math board and drawing, please wait…
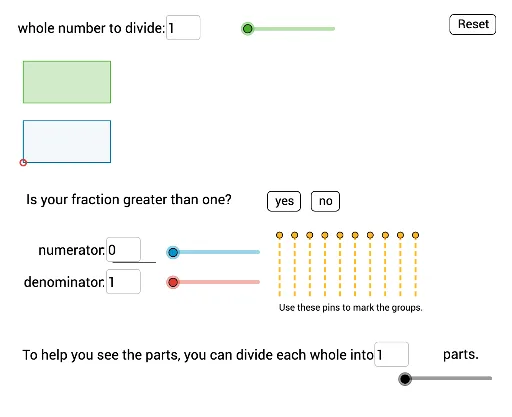
This example demonstrates how to use tape diagrams to visually represent fractions. It involves core math concepts like fractions, ratios, and geometric representation. Constructed using GeoGebra commands: Segment, Textfield, Sequence. Suitable for elementary and middle school mathematics teaching to understand fractions and ratios.
GeoGebra Commands & Parameters
Segment(B_2, I) → f_1Segment(C_2, J) → g_1Segment(D, K) → h_1Segment(E, L) → i_1Segment(F, M) → jSegment(G, H) → kSegment(N, P) → lSegment(O, Q) → mTextfield(b) → bNumeratorTextfield(d) → dDenominatorSequence(Polygon[A + ((dist * (i - 1) / d), 0), A + ((dist * i / d), 0), A + ((dist * i / d), ht), A + ((dist * (i - 1) / d), ht)], i, 1, b) → ShadePartsSegment(R_1, S_1) → pTextfield(a) → aNumberTextfield(f) → fDivideWholeSegment(U, U + (0, -3)) → qSegment(V, V + (0, -3)) → rSequence(Polygon[B + ((dist * (i - 1) / f), 0), B + ((dist * (i - 1) / f), ht), B + ((dist * i / f), ht), B + ((dist * i / f), 0)], i, 1, (f * a)) → WholeSequence(Polygon[R + ((i * dist), 0), R + (((i + 1) * dist), 0), R + (((i + 1) * dist), ht), R + ((i * dist), ht)], i, 0, h - 1) → DivisorUnitsSequence(Polygon[S + ((dist * (i - 1) / d), 0), S + ((dist * (i - 1) / d), ht), S + ((dist * i / d), ht), S + ((dist * i / d), 0)], i, 1, (h * d)) → FracPartsSequence(T_1 + (((i * 0.17) * dist), 0), i, 1, 10) → list6
AI Drawing Prompt Reference
Draw a tape diagram for teaching fractions. Start with a horizontal rectangle representing the whole, divided into equal parts with one part shaded to show the numerator. Add two text boxes for entering the numerator and denominator. Then draw another set of divided rectangles showing the whole split into more parts, with relevant sections highlighted. Include a short vertical line below as a reference mark. Keep the layout clean for classroom use.
The prompt above was compiled from the original drawing commands and is for reference only.