
Tangent, Coefficient and Parabola for a Skater
Loading the math board and drawing, please wait…
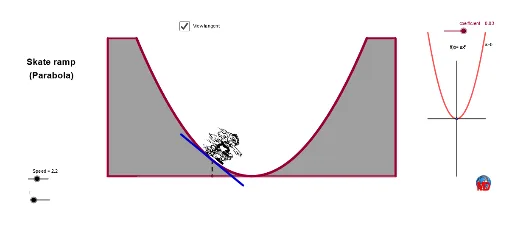
This example presents a dynamic skater-themed scene that vividly illustrates the relationship between tangents and parabolas, and how coefficient changes affect the curve's shape. The core mathematical concepts include quadratic function coefficients, tangent lines, geometric properties of parabolas, and composite constructions using transformations such as rotation and reflection, along with integrals and midpoints. The construction leverages GeoGebra commands including If, Point, Circle, Intersect, Rotate, Segment, Function, Line, Tangent, Midpoint, Mirror, Integral, Polygon, and CurveCartesian, with multiple auxiliary objects (coefficient sliders, points, segments, function graphs) to enable interactive exploration. This resource is suitable for high school or early college students, serving as a tool for understanding the connection between tangents and parabolas in analytic geometry, and as a basis for mathematical experiments or inquiry-based learning where students can observe how coefficient variations influence the graphical representation.
GeoGebra Commands & Parameters
If(coefficient < 0, 2, 0) → ppPoint(xAxis) → ACircle(A, 40) → cIntersect(c, xAxis) → B, CRotate(C, (0.05 * t), A) → DSegment(A, D) → a_2Circle(D, 80) → dFunction(f, -40, 40) → gIntersect(d, xAxis) → E, FLine(F, yAxis) → bIntersect(g, b) → GTangent(G, g) → eCircle(G, 7) → hIntersect(h, e) → H, IMidpoint(H, G) → JMidpoint(G, I) → KMirror(G, H) → LMirror(G, I) → MSegment(L, M) → iSegment(G, F) → jPoint(xAxis) → PPoint(xAxis) → QSegment(N, P) → kSegment(O, Q) → lSegment(N, R) → mSegment(S, O) → nIntegral(f, -40, 40) → oPolygon(N, R, T, P) → poly1, n_1, r, t_1, pPolygon(Q, U, S, O) → poly2, q, u, s, o_1Segment(P, Q) → f_1CurveCartesian(x(V) + i, y(V) + (10 * (coefficient * i^(2))), i, -10, 10) → vSegment(V - (10, 0), V + (10, 0)) → g_1Segment(V + (0, 20), V - (0, 20)) → h_1
AI Drawing Prompt Reference
Draw a dynamic skater-themed scene showing the relationship between tangents and parabolas, and how coefficient changes affect the curve's shape. Include a quadratic function graph with adjustable coefficients, tangent lines, geometric properties of parabolas, and composite constructions using transformations like rotation and reflection. Add elements such as integrals and midpoints, along with auxiliary objects like coefficient sliders, points, segments, and function graphs for interactive exploration.
The prompt above was compiled from the original drawing commands and is for reference only.