
Dual-Function Graph Handout: Tangent Line and Parabola Interactive Exploration
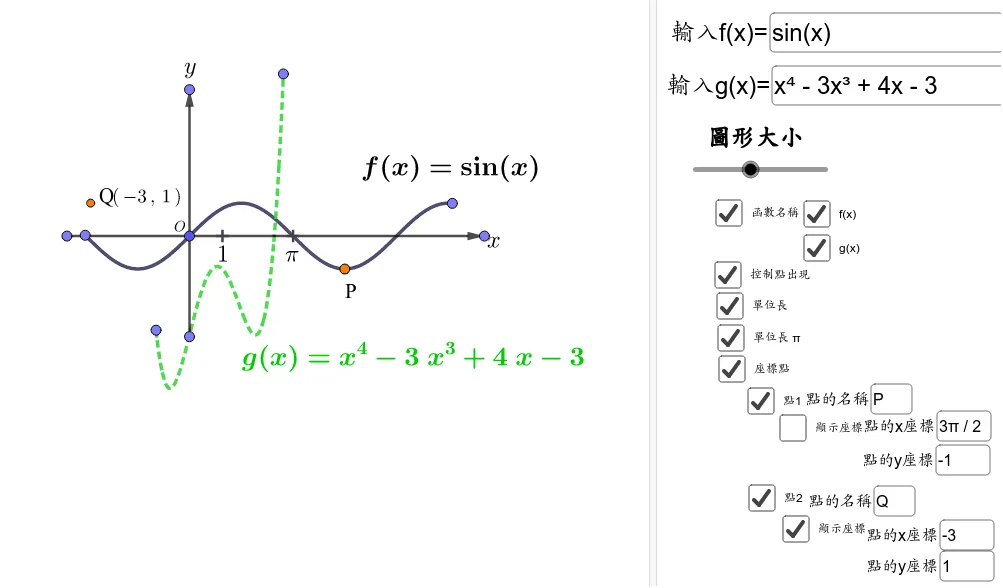
This GeoGebra example is designed for lecture notes or exam papers, demonstrating the simultaneous graphing of a tangent function and a parabola in one coordinate system. It allows users to dynamically adjust parameters via interactive input boxes and sliders, observing how the function graphs change. Core mathematical concepts include function graphing, the geometric meaning of tangent lines, the standard form of parabolas, and function transformations such as translation and scaling. The construction summary reveals the use of GeoGebra commands like Point, Vector, Textfield, and Translate, creating multiple points (e.g., O, A, B, C, D, P1, P2), vectors u and v, and text input boxes (inputBox1 to inputBox4) to control function parameters and point coordinates. The Translate command generates translated objects, while Textfield displays dynamic numerical values. This example is suitable for high school or pre-university mathematics teaching, useful for classroom demonstrations, student self-exploration, or dynamic questions in exam papers, helping learners intuitively understand the properties of function graphs and the influence of parameters on the shapes.
Loading the math board and drawing, please wait…