
T Distribution vs Standard Normal Curve
Loading the math board and drawing, please wait…
In collections
Statistical Applets
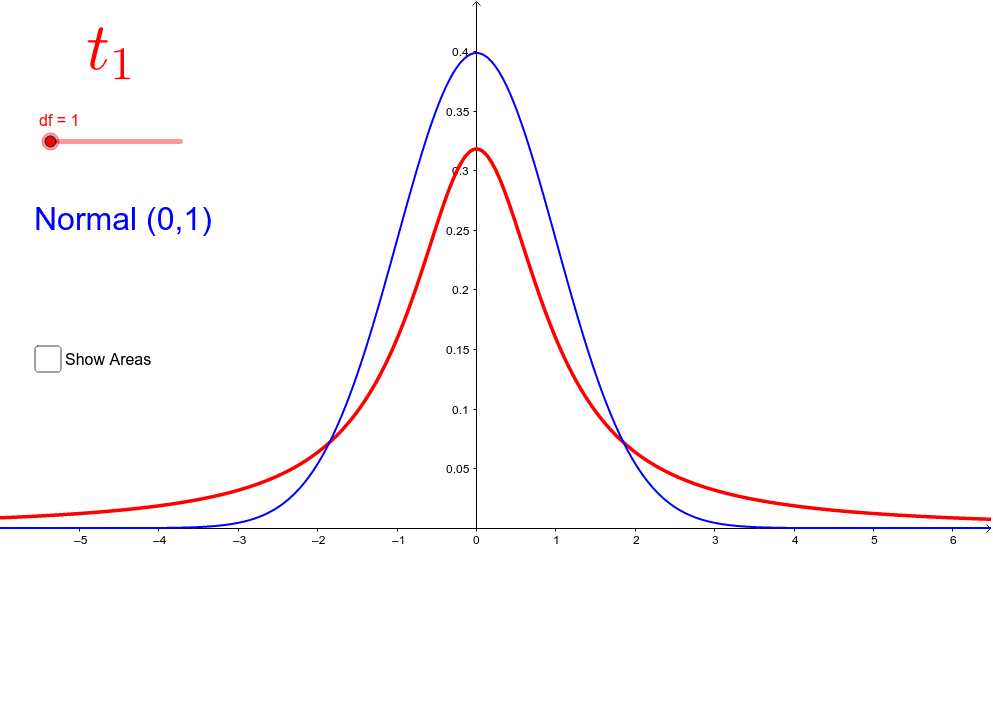
This GeoGebra example dynamically compares the t-distribution curve with the standard normal curve, highlighting differences in shape, especially tail thickness and peak height as degrees of freedom change. Core mathematical concepts include the Student's t-distribution, standard normal distribution, degrees of freedom, and probability density functions. The construction uses Point commands to create draggable sliders for degrees of freedom and other parameters, and Integral commands to compute and display shaded probability areas under the curves. Additional objects like df, t, h, A, B, c, d, and text labels are used to annotate critical values and probabilities. This resource is ideal for high school or introductory college statistics courses, helping students visualize how the t-distribution approaches the normal distribution as df increases, and understand its role in confidence intervals and hypothesis testing.
GeoGebra Commands & Parameters
Point(xAxis) → APoint(xAxis) → BIntegral(t, x(A), x(B)) → cIntegral(h, x(A), x(B)) → d
AI Drawing Prompt Reference
Draw a dynamic comparison between t-distribution and standard normal distribution curves. Create a draggable degrees of freedom slider and use integral commands to compute and display shaded areas under the curves. Label critical values and probabilities.
The prompt above was compiled from the original drawing commands and is for reference only.