
Standard Normal Curve and Probabilities
Loading the math board and drawing, please wait…
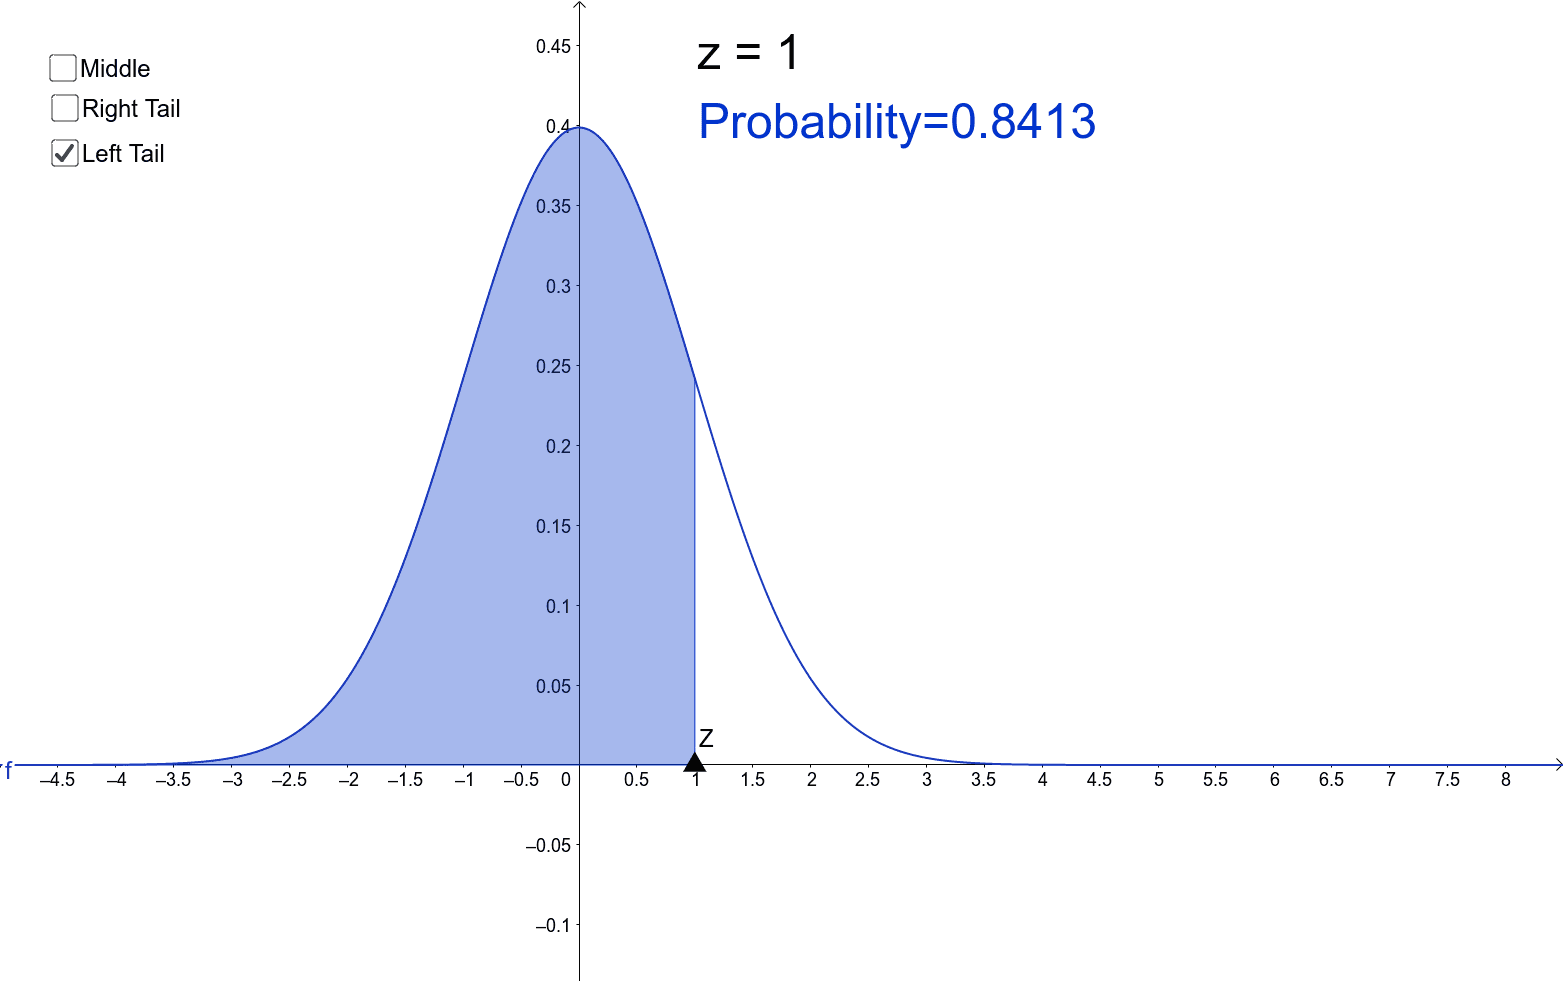
This example demonstrates the standard normal distribution curve and its probability calculations. It involves core mathematical concepts like normal distribution, integral, and probability & statistics. Construction highlights include using GeoGebra commands such as Point, Integral, If, and Textfield to plot the curve, compute integrals, and display text. Suitable for high school students and users needing to understand basic probability & statistics.
GeoGebra Commands & Parameters
Point(xAxis) → BIntegral(f, x(C), x(B), true) → aIntegral(f, x(C), x(B), true) → ProbIf(x(B) < x(C), Integral[f, x(B), x(C), true], Integral[f, x(C), x(B), true]) → gTextfield(B) → InputBox1Textfield(Zscore) → InputBox2
AI Drawing Prompt Reference
Draw a standard normal distribution curve, highlight the integral area between two points, calculate and display the probability of this area, and provide input boxes for entering the x-coordinates of the two points, showing the corresponding Z-scores.
The prompt above was compiled from the original drawing commands and is for reference only.