
Shape of the Normal Curve
Loading the math board and drawing, please wait…
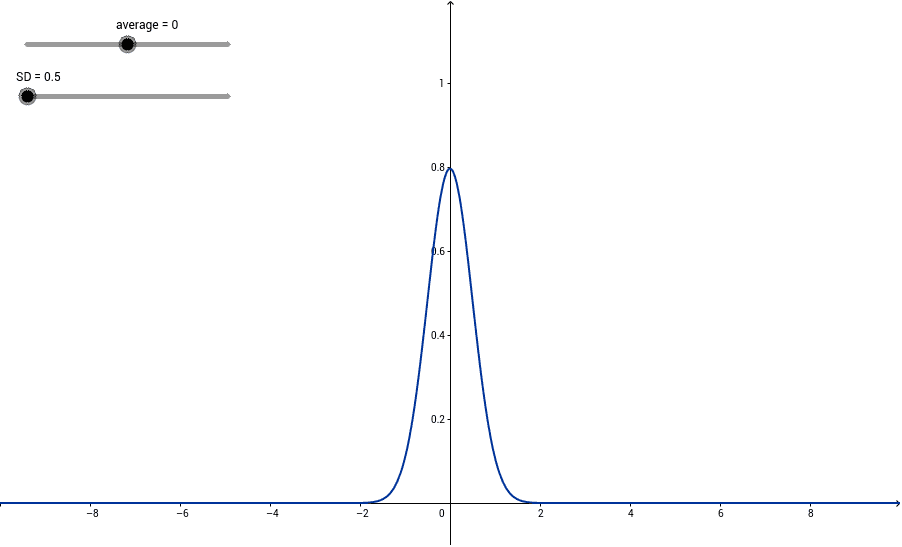
Change the mean and standard deviation to see how the normal curve changes. This example demonstrates the core concepts of normal distribution, showing how changing the mean and standard deviation affects the shape of the normal curve. It uses GeoGebra's slider animation to dynamically adjust parameters, providing an intuitive understanding of the normal distribution. Suitable for high school mathematics education and learning.
GeoGebra Commands & Parameters
Numeric SD(0.5)Numeric average(0.0)f(x) = (1 / ((SD * sqrt((2 * 3.141592654)))) * exp(((-(x - average)^(2))) / ((2 * SD^(2)))))Numeric ymin(-0.1)Numeric ymax(1.2)Numeric xmin(-10.0)Numeric xmax(10.0)