
Symmetry of Sin Curves
Loading the math board and drawing, please wait…
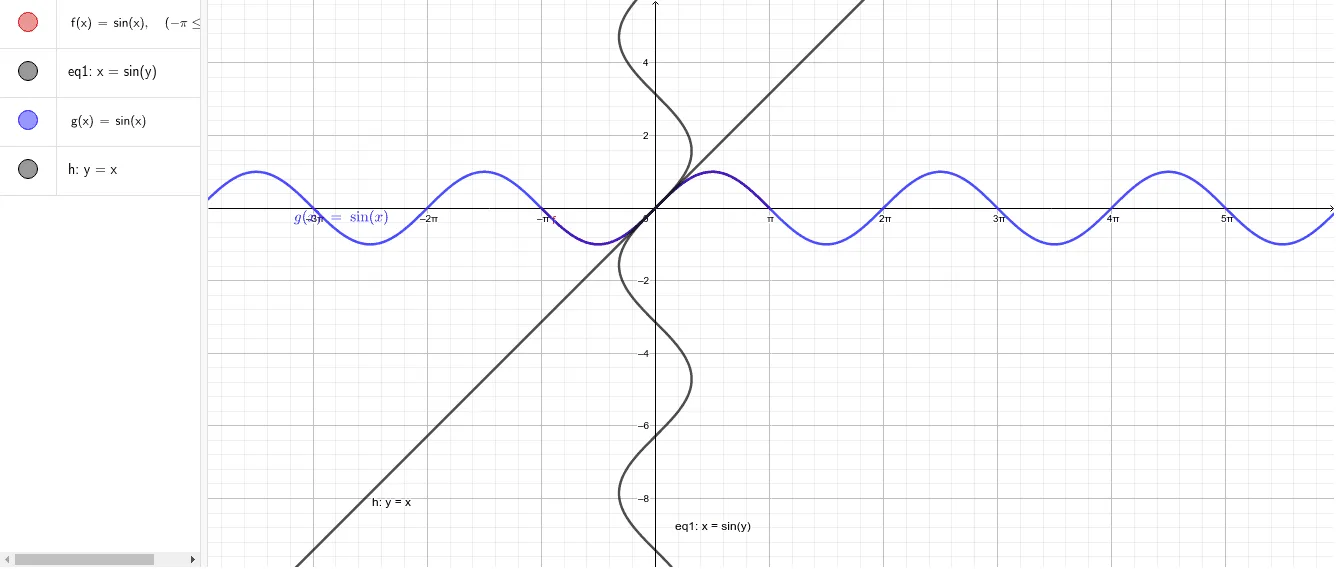
This example demonstrates the symmetry of sine curves, visually showing their central and axis symmetry through graphs. Core math concepts include symmetry, trigonometric functions, and periodicity. It uses GeoGebra objects like f (function), eq1 (equation), g (graph), and h (graph). Suitable for high school mathematics teaching to help students understand the symmetry of trigonometric function graphs and their applications.
GeoGebra Commands & Parameters
f(x) = If[(-π) ≤ x ≤ π, sin(x)]x = sin(y)g(x) = sin(x)y = x
AI Drawing Prompt Reference
Draw the symmetry of the sine curve, first plot the function y=sin(x) within the interval [-π, π], then plot the equation x=sin(y), next plot the function y=sin(x), and finally draw the line y=x to demonstrate the central and axis symmetry of the sine curve graph.
The prompt above was compiled from the original drawing commands and is for reference only.