
Sum of an Infinite Series
Loading the math board and drawing, please wait…
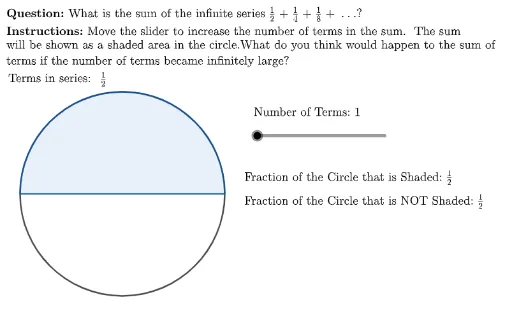
This example demonstrates how to calculate the sum of an infinite series using GeoGebra. Key mathematical concepts include sequences and limits. Commands used include Polygon, Sequence, Sector, and Zip. Suitable for high school math education and learning.
GeoGebra Commands & Parameters
UnicodeToLetter(10007) → xmarkUnicodeToLetter(10003) → cmarkPolygon({(left, bottom), (left, top), (right, top), (right, bottom)}) → viewboxLaTeX((((("\text{\textbf{Question: }" * MainInstruc) * "\\\textbf{Instructions: }") * SpecInstruc) * "}")) → allInstrucCircle(Origin, circRadius) → cSequence(1 / 2^(i), i, 1, numTerms) → allTermsSequence(1 - (1 / 2)^(i), i, 1, numTerms) → SumOfTermsSequence(Sector[c, 0, ((Element[SumOfTerms, i] * 2) * π)], i, 1, numTerms) → allSectorsSector(c, 0, (((1 - (1 / 2)^(numTerms)) * 2) * π)) → fullShadedAreaZip(NumToTfrac[A], A, allTerms) → allTermsLatexAppend(Sequence["\text{ +}", i, 1, numTerms - 1], "") → plusSignsTableText({Flatten[Zip[(A * B), A, allTermsLatex, B, plusSigns]]}) → seriesDisplayTableText({{(("\text{\vphantom{\dfrac{1}{2}}Fraction of the Circle that is Shaded: \(" * NumToTfrac[1 - 1 / 2^(numTerms)]) * "\)}"), (("\text{Fraction of the Circle that is NOT Shaded: \(" * NumToTfrac[1 / 2^(numTerms)]) * "\)}")}}, "v") → dataDisplay
AI Drawing Prompt Reference
Draw a graph of an infinite series, including a circle with a radius of 1 centered at the origin. Use a sequence to generate a series of fractions starting from 1/2, where each fraction is half of the previous one. These fractions represent the shaded parts of the circle, with each sector's area equal to twice the corresponding fraction of the circle's circumference. Finally, display the proportion of the circle's central angle that is shaded and unshaded.
The prompt above was compiled from the original drawing commands and is for reference only.