
Visualization of Irrational Exponents and Approximation
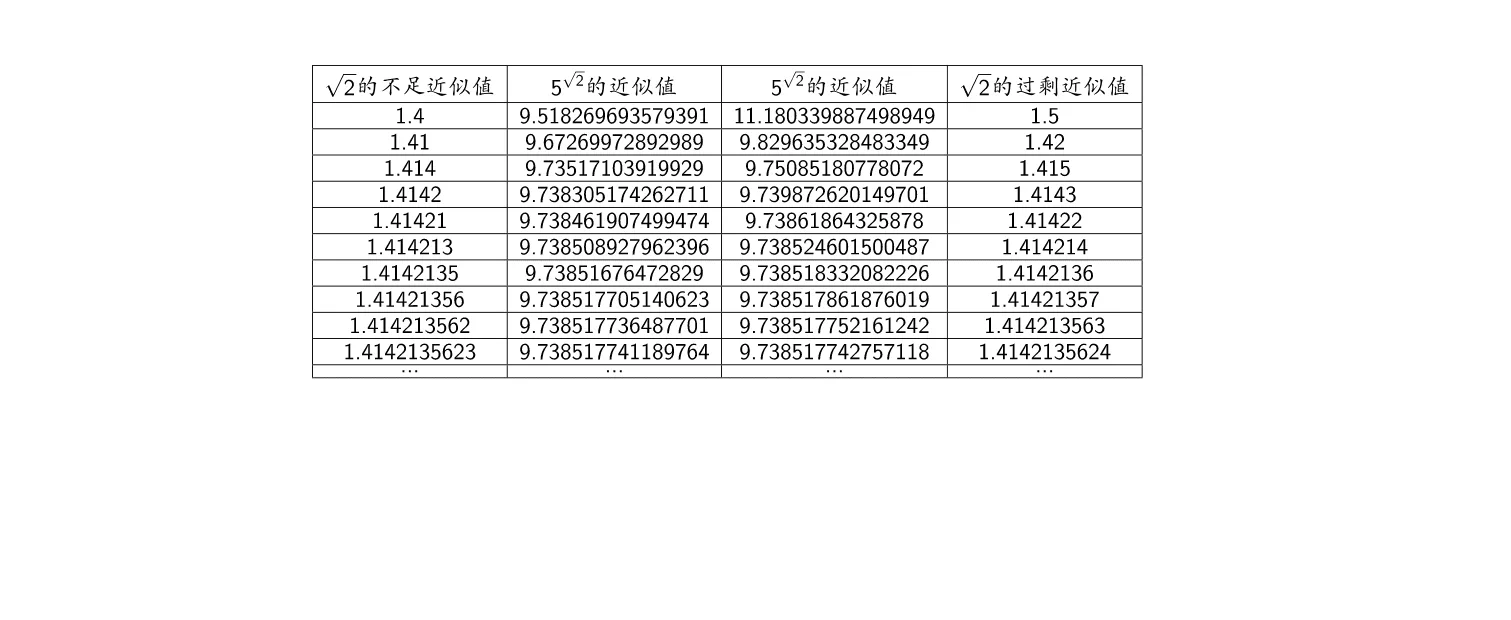
This example provides a dynamic visualization of the definition of irrational exponents. It demonstrates the core mathematical concept that an irrational power $a^x$ is defined as the limit of a sequence of rational powers. The construction utilizes GeoGebra commands such as Sequence and Zip to generate the approximation sequence, and TableText and Text to organize the iterative calculations into a readable table format (objects l1 through l13). This tool is ideal for high school or undergraduate students studying the foundations of power functions, limits, and real analysis.
Loading the math board and drawing, please wait…