
Approximating π via Euler: a Sequence-Based Visualization
Loading the math board and drawing, please wait…
In collections
Pi Approximations
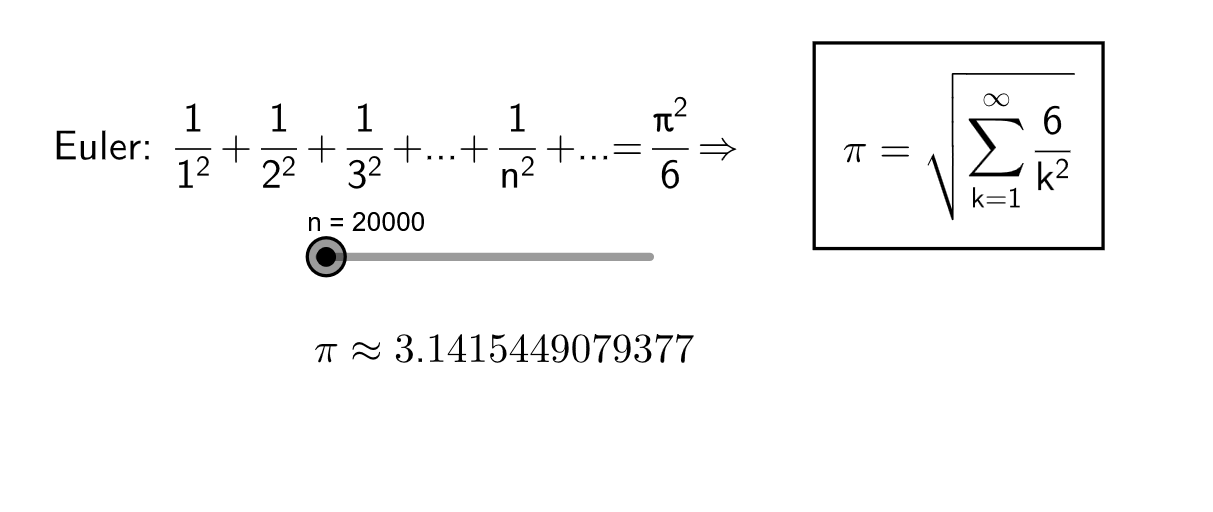
This example demonstrates how Euler’s idea can be turned into a computable sequence that approximates the constant π, and how the approximation improves as the number of terms (iteration index) increases—typically visualized through points or a convergence trend. The main mathematical concepts include real numbers, sequences and (implicitly) series approximations, and the limit (Limes) viewpoint that explains why the values approach π. Construction-wise, the setup is guided by the listed objects Text1, Text2, n, p, and Text3: Text1/Text2/Text3 are used to present explanatory labels (method, current value, or error), while n acts as the controlling parameter/index (e.g., the term count or iteration step), and p represents the computed approximation (or related quantity such as the deviation from π). The interactive/parametric role of n together with the displayed p enables learners to see the convergence behavior clearly. Suitable for upper-secondary students through early university courses, particularly for teaching limits, convergence of sequences, and numerical approximation of constants.
GeoGebra Commands & Parameters
Numeric n(20000)sqrt((6 * Sum[1 / k^(2), k, 1, n]))
AI Drawing Prompt Reference
Create a dynamic sequence plot illustrating Euler's approximation of pi. Include an adjustable integer parameter representing the number of terms, and a point whose y-coordinate is the current approximation. Display three text labels: one for the method name, one for the current value, and one for the error from pi. As the parameter increases, the point should approach a horizontal reference line at pi, showing convergence. Add coordinate axes and grid for clarity.
The prompt above was compiled from the original drawing commands and is for reference only.