
Subtraction of Decimals Using Grid Model
Loading the math board and drawing, please wait…
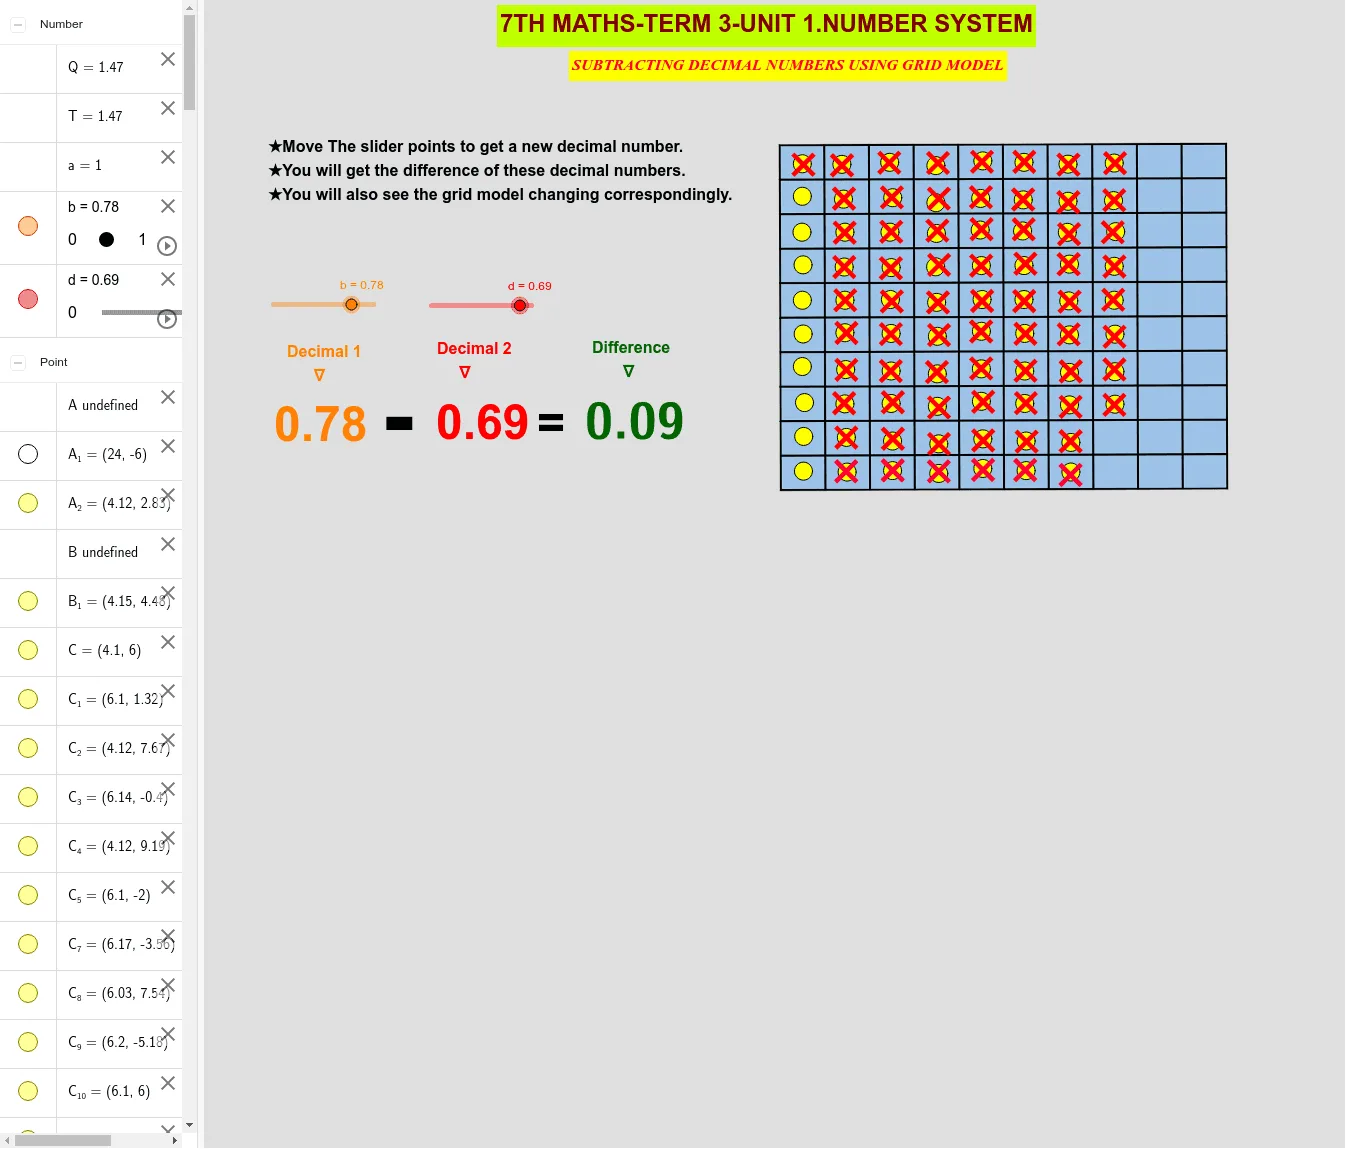
This example demonstrates decimal subtraction using a grid model. It involves the core mathematical concept of decimal subtraction. Using GeoGebra commands such as Random and Segment, the process of decimal subtraction is dynamically illustrated. Suitable for 7th grade students and teachers.
GeoGebra Commands & Parameters
Random(0.01, 1) → aSegment(A, B) → fSegment(D, I) → gSegment(J, K) → hSegment(U, V) → iSegment(W, D_1) → jSegment(E_1, F_1) → kSegment(G_1, H_1) → lSegment(I_1, J_1) → mSegment(K_1, L_1) → nSegment(M_1, N_1) → pSegment(Q_1, R_1) → qSegment(T_1, U_1) → r
AI Drawing Prompt Reference
Draw a grid model to illustrate decimal subtraction. First, draw a grid. Then, randomly generate two decimals a and b, and use segments to represent their values on the grid. Next, draw segments representing the fractional parts of a and b, and finally, draw segments representing the fractional part of a-b.
The prompt above was compiled from the original drawing commands and is for reference only.