
Subdivided Bar Graph
Loading the math board and drawing, please wait…
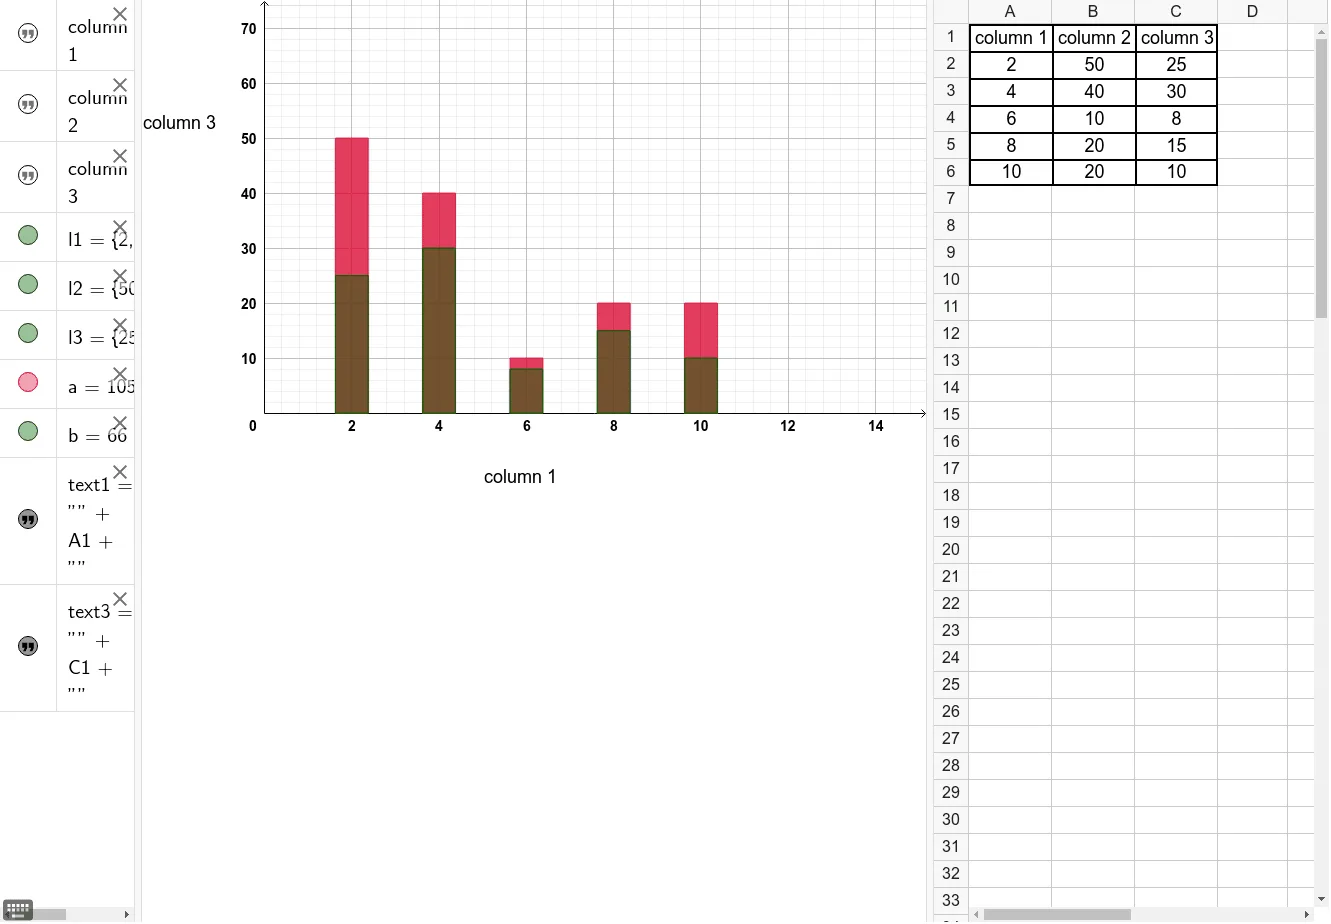
This example demonstrates the creation of a subdivided bar graph. Key mathematical concepts include statistics and data grouping. Using the BarChart command in GeoGebra, a subdivided bar graph can be easily created. Suitable for middle school and above students or teachers for teaching and learning.
GeoGebra Commands & Parameters
BarChart(l1, l2, 0.75) → aBarChart(l1, l3, 0.75) → b
AI Drawing Prompt Reference
Create a subdivided bar graph with two sets of bars placed side by side for each category. The first set of bars uses one color, and the second set uses a different color. All bars have the same width and are adjacent to each other. The horizontal axis represents categories, and the vertical axis represents values. The graph should clearly show the comparison between the two data sets across categories, with a neat layout for easy observation of differences.
The prompt above was compiled from the original drawing commands and is for reference only.