
Strange Functions Demonstration
Loading the math board and drawing, please wait…
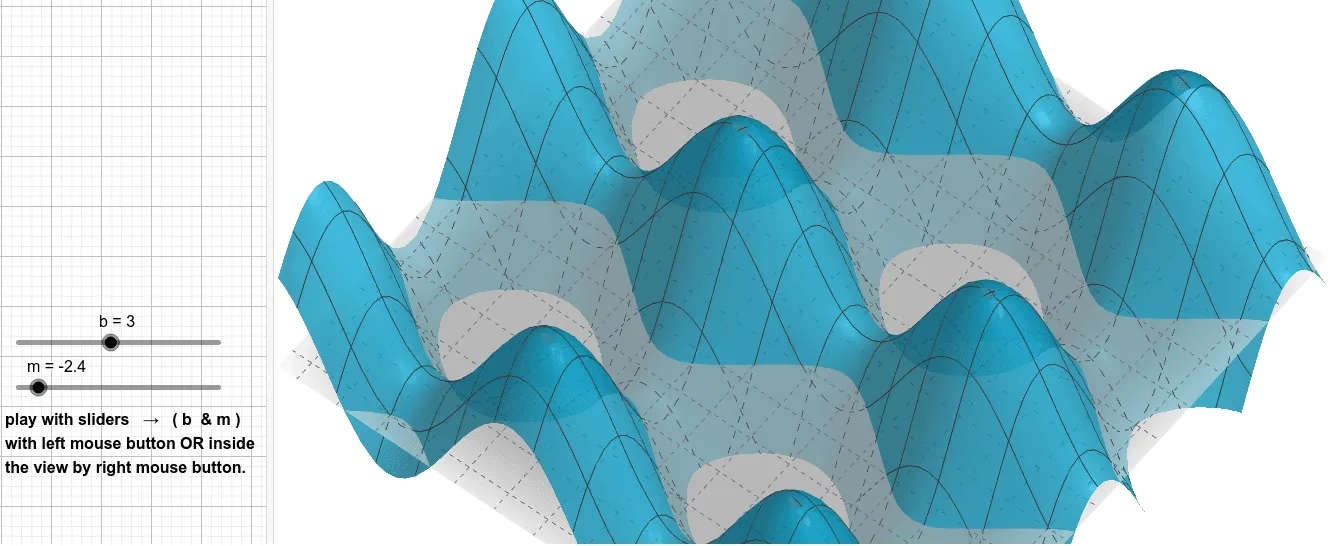
This example demonstrates the effect of dynamically adjusting parameters m and b on the function's graph. Key math concepts include function graphs, parameter influence, and geometric transformations. It uses GeoGebra commands/objects like sliders m and b, points U and H, and text object text2. Suitable for high school mathematics teaching on function graph changes and parameter effects.
GeoGebra Commands & Parameters
Numeric m(-2.4)Numeric b(3.0)U(x) = (m * x) - bH(x, y) = (m * sin(x)) + (b * cos(y))
AI Drawing Prompt Reference
Draw a function graph with two adjustable parameters m and b. First, draw the line y = mx - b, then draw the curve y = m * sin(x) + b * cos(y). Observe the changes in the line and curve by adjusting the values of m and b.
The prompt above was compiled from the original drawing commands and is for reference only.