
Step Through Quantitative Freq. Dist. Construction
Loading the math board and drawing, please wait…
In collections
Statistics Step Through Applets
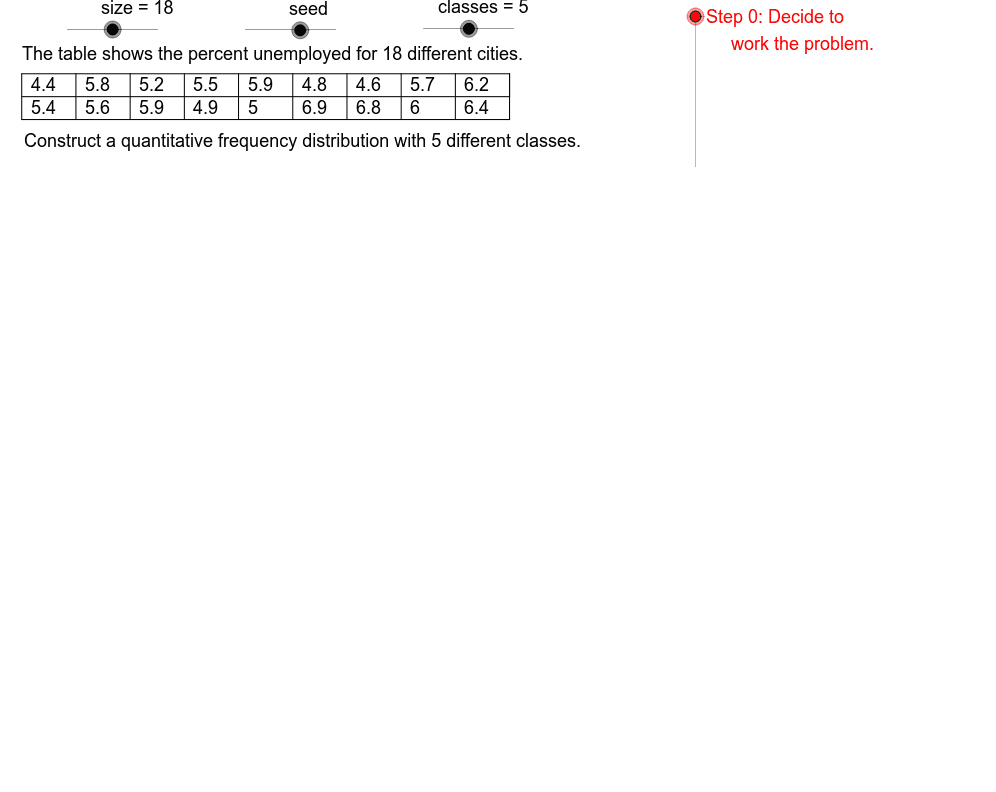
This applet demonstrates the steps involved in creating a quantitative frequency distribution. Students can select different data sets and follow the process to build a frequency distribution table. Key statistical concepts such as data grouping and frequency calculation are covered. Using GeoGebra commands like Mod, Sequence, CountIf, etc., the construction process is dynamically illustrated. Suitable for introductory statistics learners.
GeoGebra Commands & Parameters
Mod(seed, 3) → ACDTSequence(RandomPoisson[seed], k, 1, size) → L0Sequence((Element[L0, k] * 10^((-ACDT))), k, 1, size) → L1Min(L1) → Min1Max(L1) → Mx1If(CWC1 ≤ UB, CWC1, If[CWC2 ≤ UB, CWC2, If[CWC3 ≤ UB, CWC3, CWC4]]) → CW0Sequence(k, k, Min1, Min1 + ((classes - 1) * CW0), CW0) → LCLSequence(Element[L1, k], k, 1, size1) → L2Sequence(Element[LCL, k], k, 1, classes - 1) → LCL0Sequence(i, i, Min1, Mx1, 10^((-ACDT))) → DomainSort(Intersection[Domain, L1]) → RangeCountIf(x < Mx1 + 1, Range) → RngCntSequence(CountIf[i ≤ x < i + CW0, L1], i, Min1, Mx2 - CW0, CW0) → FrqSqMax(FrqSq) → MxFrqMax(Sequence[If[floor((10^(k) * CW0)) / 10^(k) ≠ CW0, k + 1, 0], k, 0, 2]) → ACCWMax(ACDT, ACCW) → ACNwSequence(" to ", k, 1, classes) → ToSqSequence(If[k ≟ 1, " ", " + "], k, 1, classes) → PlsAppend(Min1, LCL0) → LCLCnSqSequence(" = ", k, 1, classes) → EqSqElement(LCL, 2) → LCL2Sequence(Element[L1, k], k, size1 + 1, size) → L3Polygon(FDUL, FDLL, FDLR, FDUR) → fdpoly, fdlf, fdbt, fdrt, fdtpSegment(DTML, DTMR) → dtmdSegment(DTLL, DTLR) → dtbtSegment(DTMR, DTUR) → dtrtSequence(CW1, k, 1, classes - 1) → CWSq1Append(" ", CWSq1) → CWSq2Sequence(UCL1 + (k * CW1), k, 0, classes - 1) → UCLAppend(UCL1, UCL) → UCLCnSequence(Sequence[" | ", k, 1, Element[FrqSq, j]], j, 1, classes) → TlySqSegment(DTUL, DTUR) → dttpSequence(Segment[(DTLf + (k * DTCW), DTBt), (DTLf + (k * DTCW), DTTp)], k, 0, floor(size / 2)) → VlinesText("The table shows the percent unemployed for " + size + " different cities.") → DD1Text("The table shows numbers of bird feeders sold in " + size + " different months.") → DD0Text("The table shows proportions of students who earned C's in " + size + " different classes.") → DD2Element(DDSq, ACDT + 1) → DDIf(ACDT ≟ 1, ".", "s.") → PLP1If(ACCW ≟ 1, "", "s") → PLN2If(ACNw ≟ 1, ".", "s.") → PLP3If(ACNw ≟ 1, "", "s") → PLN3Sequence(Text[Element[LCL, k], (FDTxLf, FDTxTp - (FDRH * k))], k, 1, classes) → LCLTx2If(ACDT ≟ 1, "", "s") → PLN1Sequence(Text[Element[FrqSq, k], (FDTxLf + 25, FDTxTp - (FDRH * k))], k, 1, classes) → FrqTxSqSequence(Text[Element[UCL, k], (FDTxLf + 8, FDTxTp - (FDRH * k))], k, 1, classes) → UCLTx2Text("Construct a quantitative frequency distribution with " + classes + " different classes.") → PrbStmSequence(Text[Element[ToSq, k], (FDTxLf + 4.5, FDTxTp - (FDRH * k))], k, 1, classes) → ToTxSequence(Text[Element[L1, k], ((k * DTCW) + DTLf - 5, DTRL1)], k, 1, ceil(size / 2)) → DtRw1Sequence(Text[Element[L3, k], ((k * DTCW) + DTLf - 5, DTRL2)], k, 1, ceil(size / 2)) → DtRw2Sequence(Text[Element[LCL, k], (14, ClcHt - (FDRH * k))], k, 1, classes) → LCLTx1Sequence(Text[Element[CWSq1, k], (6, ClcHt - ((k + 1) * FDRH))], k, 1, classes - 1) → CWTx1Sequence(Text[Element[EqSq, k], (11.5, ClcHt - ((k + 1) * FDRH))], k, 1, classes - 1) → EqTx1Sequence(Text[Element[Pls, k], (3, ClcHt - (k * FDRH))], k, 1, classes) → PlsTx1Sequence(Text[Element[LCLTx2, k], ((-2), ClcHt - ((k + 1) * FDRH))], k, 1, classes - 1) → LCLCnTxSequence(Text[Element[UCLCn, k], (21, ClcHt - (FDRH * k))], k, 2, classes) → UCLCnTxSequence(Text[Element[Pls, k], (26, ClcHt - (FDRH * k))], k, 1, classes) → PlsTx2Sequence(Text[Element[CWSq1, k], (28.5, ClcHt - ((k + 1) * FDRH))], k, 1, classes - 1) → CWTx2Sequence(Text[Element[EqSq, k], (34, ClcHt - (FDRH * k))], k, 2, classes) → EqTx2Sequence(Text[Element[UCL, k], (37, ClcHt - (FDRH * k))], k, 1, classes) → UCLTx1Sequence(Sequence[Text[Element[Element[TlySq, k], j], (FDTxLf + 14.2 + (0.6 * j), FDTxTp - (FDRH * k))], j, 1, Element[FrqSq, k]], k, 1, classes) → TlyTxSq
AI Drawing Prompt Reference
Create a dynamic statistical chart demonstrating the construction of a quantitative frequency distribution. Include data grouping, frequency calculation, and selection of multiple datasets. Show the process from raw data to frequency distribution table, including data points, class intervals, frequency counts, and a histogram, illustrating the transformation step-by-step.
The prompt above was compiled from the original drawing commands and is for reference only.